

Altcoin prices collapsed after the US Securities and Exchange Commission (SEC) announced lawsuits against Binance and Coinbase at the start of the week. Aside from the action against the two largest cryptocurrency exchanges, investors appear to be concerned as the SEC has designated 23 cryptocurrencies as securities in the two lawsuits. This brings the total number of cryptocurrencies that the SEC has described as securities to 67.
Among the chaos, a slight positive is that Bitcoin (BTC) and Ethereum (ETH) have held up relatively well. This indicates that institutional investors do not panic and dump their positions. Due to their superior performance, Bitcoin dominance It rose to a year-to-date high of 47.6% and Ether to 20%.
The uncertainty in the near term is likely to keep many investors on the sidelines. During this period, cryptocurrencies that have generally held up tend to do well when market sentiment improves.
Let’s take a look at the top 5 cryptocurrencies that are trying to hold their support levels and trying to start a rebound. What are the important support and resistance levels to watch?
Bitcoin price analysis
Bitcoin fell back to the crucial support level at $25,250 on June 10, indicating that the bears are continuing to press. Frequent retesting of the support level over short periods tends to weaken it.

The moving averages sloping down and the relative strength index (RSI) in negative territory indicate that the bears are in control. If the support area breaks down between $25,250 and $23,896, the BTC/USDT pair could see a panic selling. After that, the pair may drop to the psychological vital level of $20,000. Buyers are expected to protect this level with all their might.
If the bulls want to prevent a sharp decline, they will have to quickly push the price above the 20-day exponential moving average ($26,721). Such a move would suggest strong demand at lower levels. The pair may rise first to the 50-day simple moving average (27,464 USD) and later to the channel resistance line. Buyers will have to push the price above this level to signal the resumption of the upward movement.
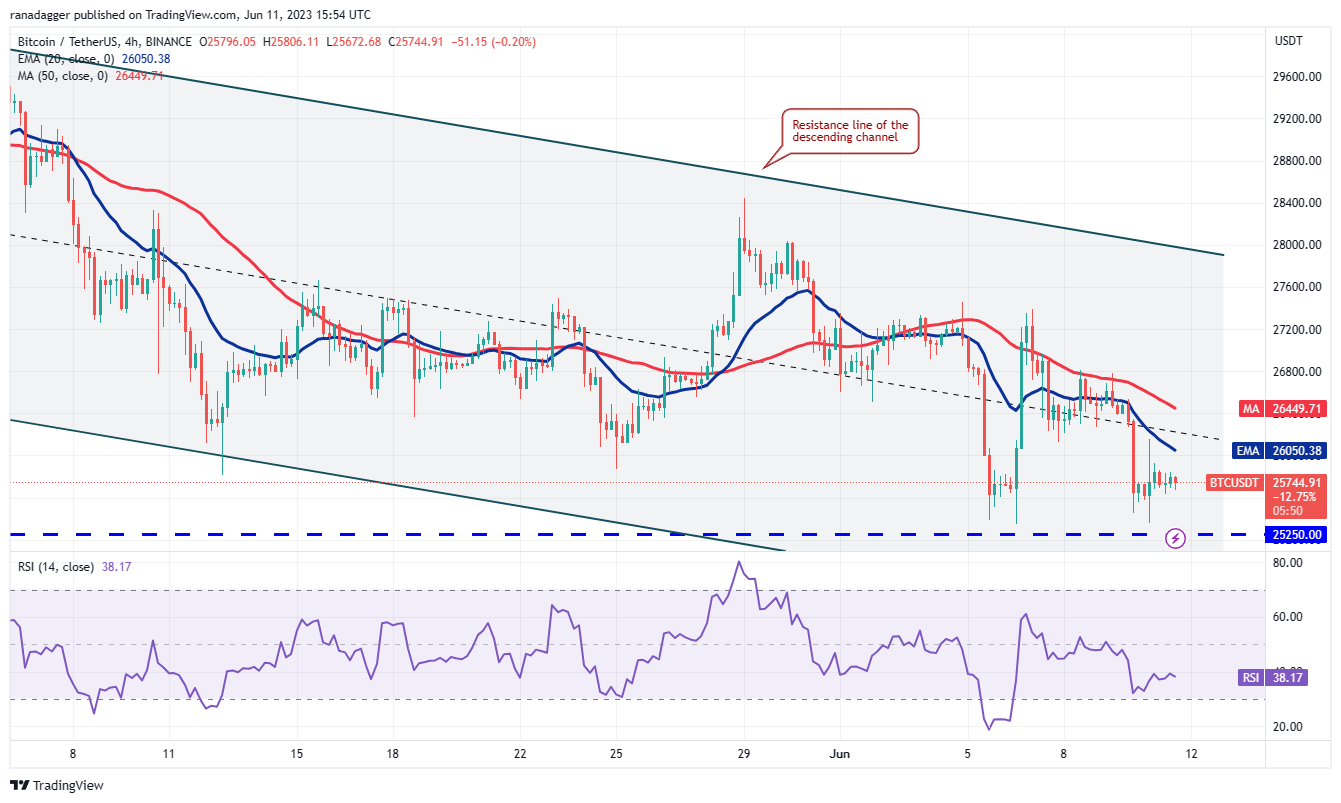
The 4-hour chart shows that the rebound from the $25,250 support faces selling at the 20-EMA. This indicates that the bears are not giving the bulls any chance to come back. The bears will have to plunge the price below $25,250 to consolidate their position.
Conversely, if the price rises and breaks above the 20-EMA, the pair may rise to the 50-SMA. If this level is broken, the pair is likely to move towards $27,400.
Ether price analysis
Ether has been in a corrective phase for the past several days. Bears pulled the price below the 50% Fibonacci retracement level at $1,755 on June 10, but the bulls prevented a breakdown as it defended the strong support at $1,700.

The bulls will try to start a relief rally that could reach the 20-day moving average ($1835). This is an important level to watch out for because a break and a close above it would indicate that the ETH/USDT pair could remain range bound between $1700 and $2000 for some time.
On the contrary, sellers will try to stop the recovery and pull the price below the $1,700 support. If they can pull it back, the pair may start the next stage of correction. Minor support is at $1,600 but if it fails to hold, the pair could collapse to $1,352.
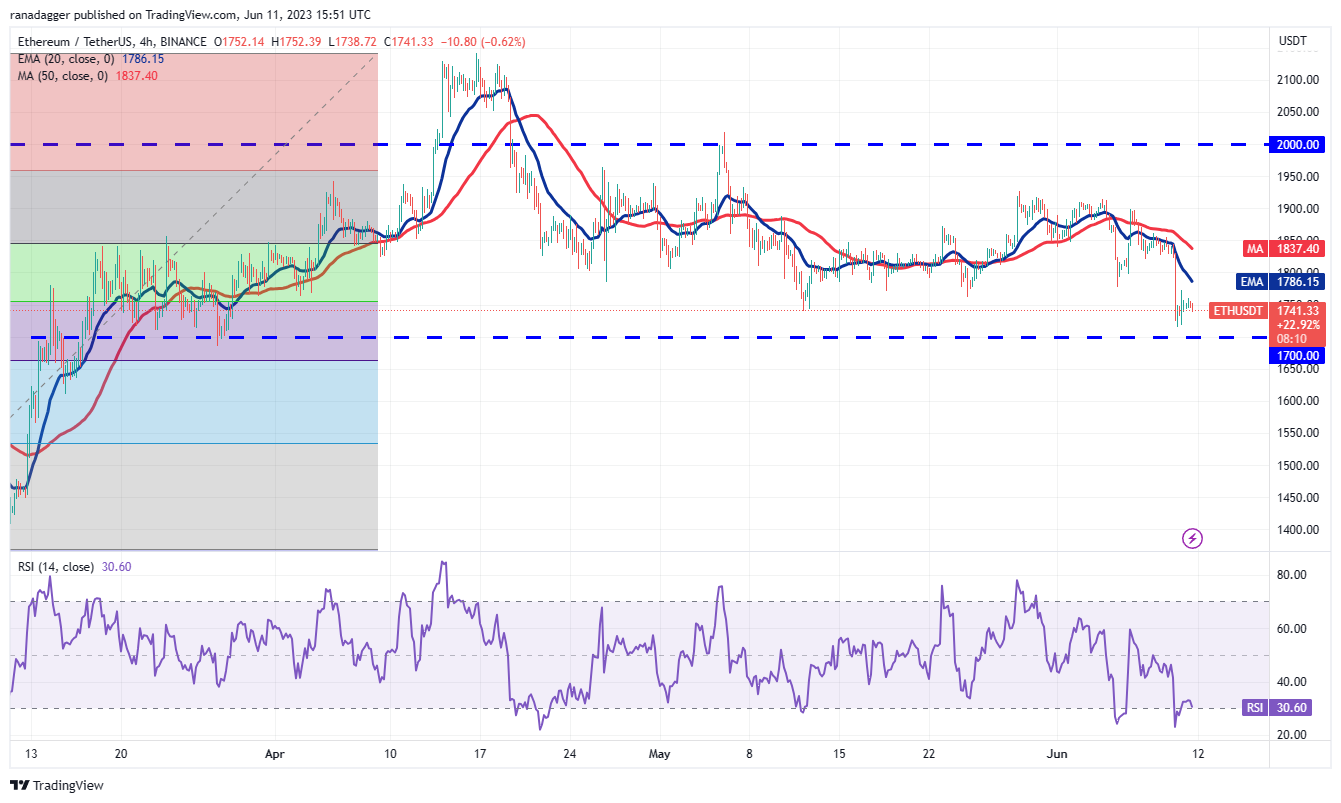
The 4 hours chart shows that the bulls had previously aggressively protected the $1700 level and may try to do so again. Buyers will have to clear the hurdles at the moving averages to start a sustainable recovery that could lift the price to $1,920.
On the contrary, if the price falls below the current level or the moving averages, the bears will again try to plunge the pair below $1,700. If they succeed, the selling may accelerate and the pair may retest $1,352.
XRP price analysis
XRP (XRP) broke down from the overhead resistance near $0.56 on June 10 and fell below the 20-day moving average ($0.50).

However, the positive sign is that the buyers immediately bought the dip to the 50 day SMA ($0.47) as indicated by the long tail on today’s candlestick. The 20-day EMA is an important level for the bulls because if the price holds above it, the XRP/USDT pair could reach again near $0.56.
Alternatively, if the price declines and breaks below the 20-day EMA, it would indicate that higher levels are attracting sellers. The pair may then drop to the 50-day simple moving average. A break and close below this level could start a deeper drop to $0.41.
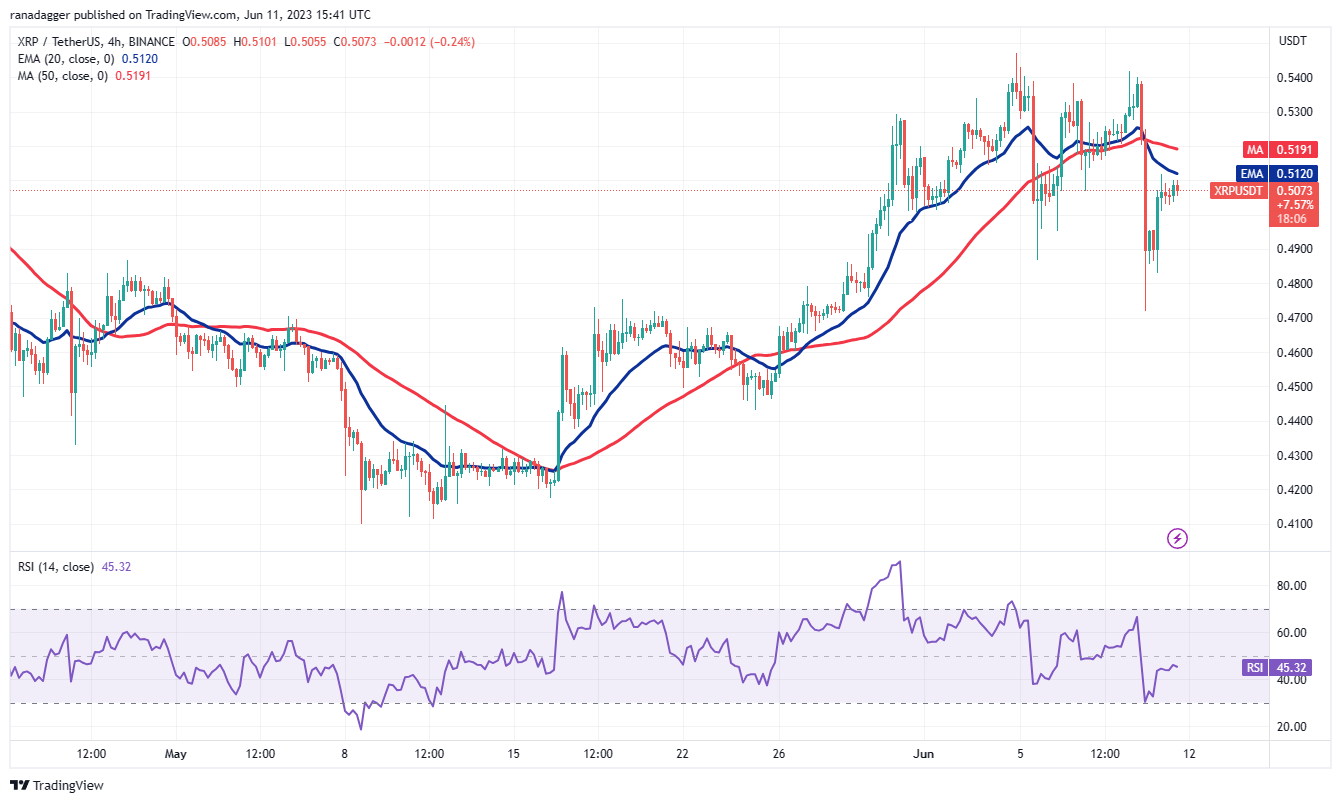
The 4 hours chart shows that the recovery is selling, near the 20-EMA. This suggests that the short-term sentiment remains negative and bears are selling on rallies. If the price drops below the current level, the bears will try to push the pair below $0.47. If they can do so, the pair could drop to $0.44.
On the other hand, if buyers push the price above the moving averages, it will pave the way for a potential rally to $0.55.
Related: The United States will find the “correct result” of cryptocurrency, in the end – the CEO of Coinbase
Lido DAO price analysis
Lido DAO (LDO) has fallen within a bearish channel pattern over the past few days, which indicates that the bears are in control.

LDO/USDT fell sharply on June 10 but the long tail on today’s candle shows that the bulls are buying aggressively on dips to the support at $1.57. Buyers will try to start a recovery that could reach the moving averages.
However, sellers will likely have other plans. They will not want to give buyers any leeway and will try to sink the price to $1.57. If this level is broken, the pair may start falling to the channel support line near $1.
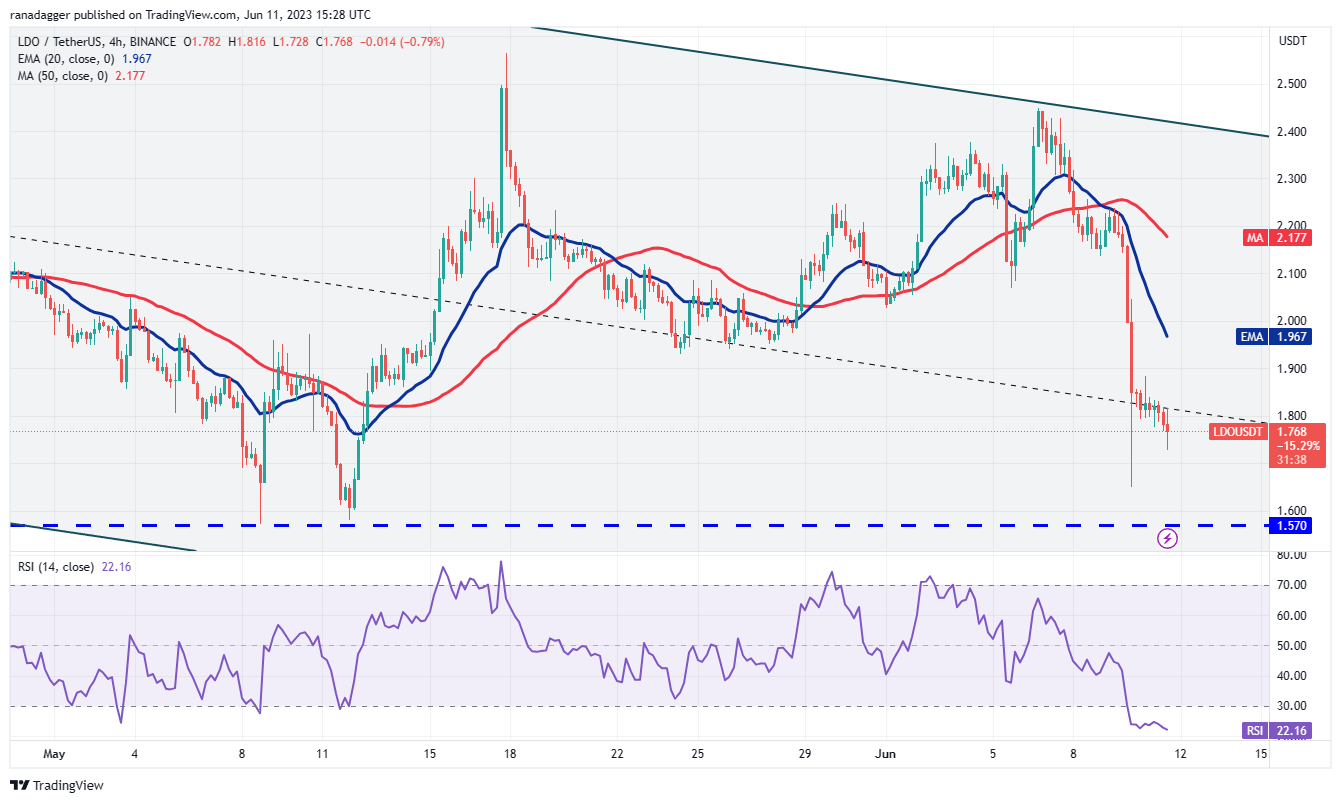
Deep oversold levels on the RSI indicate that a comfortable rally may be just around the corner. Buyers tried to start the recovery but the bears did not allow the price to rise above $1.90. Thus, this becomes an important hurdle for buyers to cross over to start a recovery.
The pair could then rally to the 20-EMA where the bulls are likely to face strong selling from the bears. Buyers need to overcome this hurdle to start a stronger rally. This positive outlook will be invalidated in the near term if the price drops below $1.65.
Provide symbol price analysis
Render Token (RNDR) corrected sharply on June 10 and dropped below the uptrend line but the slight positive is that the bulls are trying to push the price back above the breakdown level.

If the price continues above the uptrend line, it would indicate that the recent crash may have been a bearish trap. The RNDR/USDT pair could then climb towards the 20-day moving average ($2.31) where it is likely to face its real test.
Alternatively, if the price fails to stay above the uptrend line, it will indicate that the bears have reversed the uptrend line into resistance. The pair could then extend its decline and drop to the next support level near $1.60.
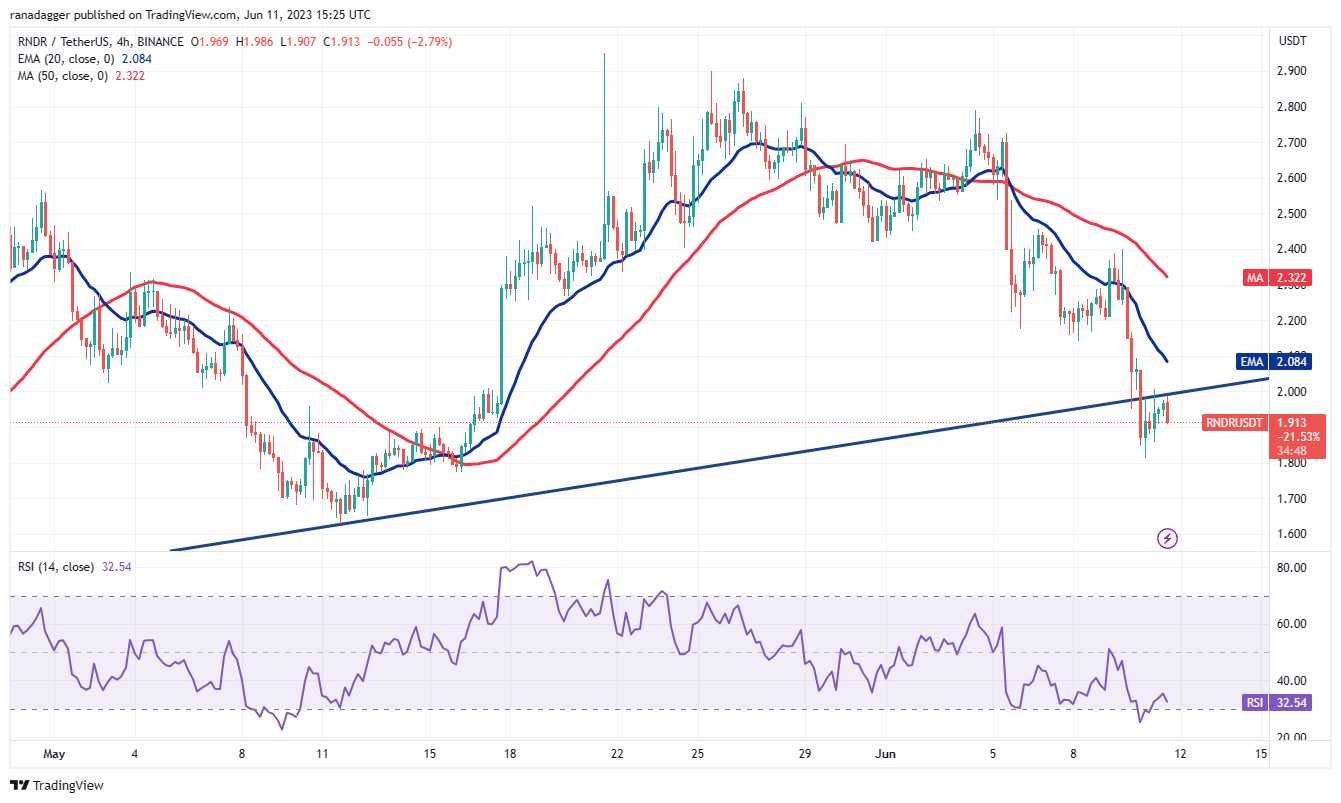
The 4 hours chart is showing that the bulls are trying to push the price back above the breakdown level, but the bears are holding on. The area between the bullish trend line and the 20-EMA remains the key level to watch. If the price breaks above this area, the pair may recover to $2.40.
On the contrary, if the price continues to decline from the current level and breaks below $1.80, it would indicate a resumption of the bearish trend. The pair may then drop to $1.60 as buyers are likely to mount a strong defense.
This article does not contain investment advice or recommendations. Every investment and trading move involves risk, and readers should do their own research when making a decision.
This article is for general information purposes and is not intended and should not be considered legal or investment advice. The views, ideas and opinions expressed herein are those of the author alone and do not necessarily reflect or represent the views and opinions of Cointelegraph.