
USD/CHF is breaking above a few important resistance levels!
Will this translate to a longer-term bullish reversal for the pair?
I don’t know if you’ve noticed, but 2023 has NOT been a good year for USD/CHF.
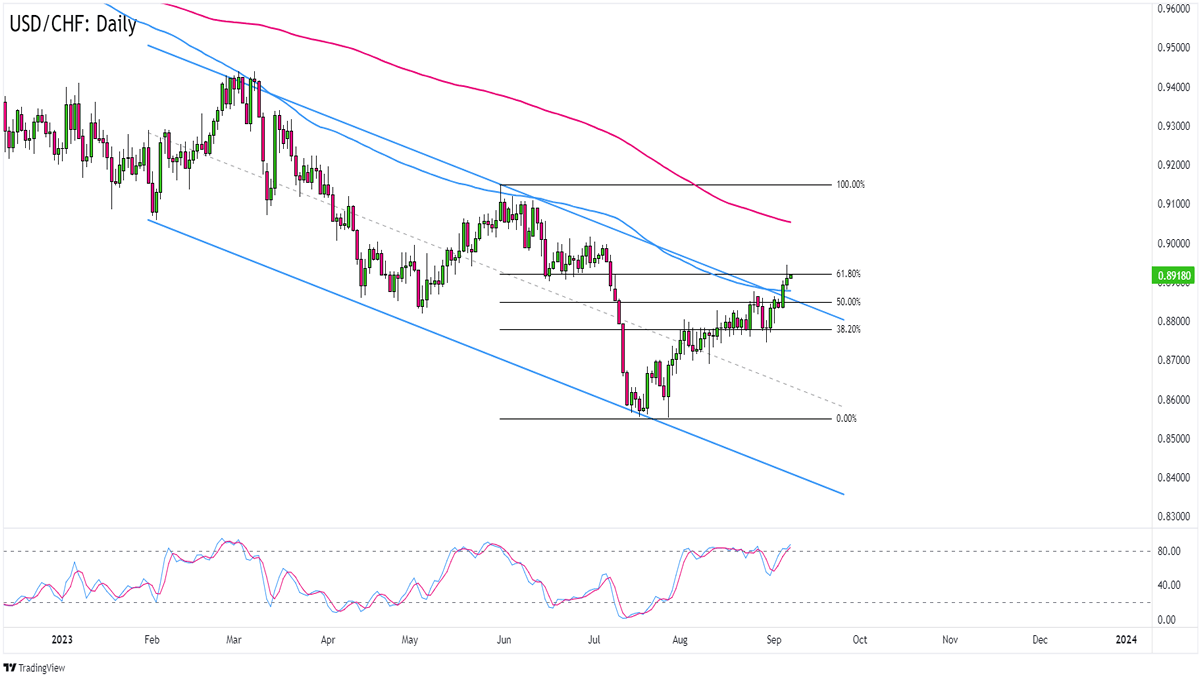
The pair has been trading in a downtrend for most of the year after getting rejected from the .9400 psychological handle.
USD/CHF Daily Forex Chart by TV
What makes the pair interesting today is that USD/CHF is breaking above key resistance levels that had been limiting the pair’s gains.
USD/CHF is currently trading above the daily chart’s 100 SMA AND the descending channel resistance that’s been around since March.
Are we looking at a bullish reversal in the making?
The bullish candlesticks on the chart are saying “Bet.” But take note that USD/CHF’s current prices still line up with the 61.8% Fibonacci level while Stochastic is already signaling the pair’s “overbought” levels.
Watch how consistent USD/CHF trades above the channel and 100 SMA resistance zones. If we see bigger wicks or red candlesticks just above .8900, then USD/CHF may have a chance to extend its downtrend.
Shorting the fakeout and aiming for the .8775 previous area of interest may work if there’s enough USD selling in the next few days.
But if USD/CHF stays above the trend line resistance, or if we see a break-and-retest pattern in the next candlesticks, then y’all better prepare for possible trips to areas of interest such as .9000 or .9050!