
We’re back checking out GBP/USD ahead of what could be a very eventful week of data from both the U.S. and the U.K.
Will it be enough to break the consolidation of the four hour chart or are there more range plays ahead?
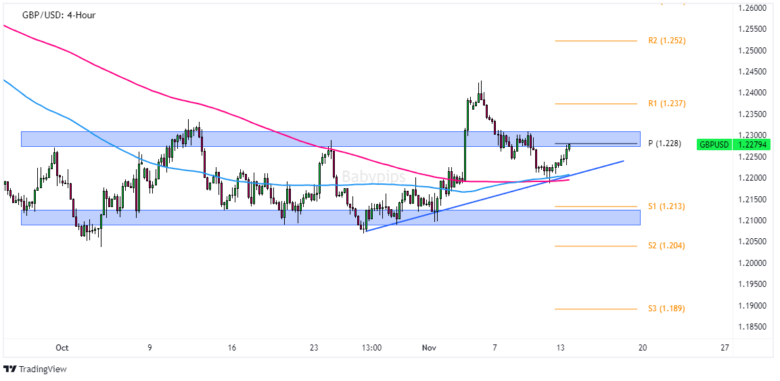
GBP/USD 4-Hour Chart by TradingView
As always, a currency pair’s next move is determined by the fundamentals, and in Cable’s case, it’s likely that the outcome of the U.K. jobs update and the U.S. CPI update this week may determine the pair’s next move.
If you haven’t caught up on those two events, you can check out our Event Guides (U.S. CPI Report (October 2023) & U.K.’s Jobs Update (October 2023)) to raise your awareness on the drivers and possible price scenarios to watch out for.
Based on your study and when you come to your eventual biases, there are pretty simple setups to watch for in the short-term, and several to watch out in the longer-term, especially if volatility really picks up.
In the short-term, the potential technical triggers that may draw in more buyers are a break of the top of the range marked on the chart above, where several tops around the 1.2300 level have been highlighted.
A bullish break there has pretty strong odds of drawing in more bulls at the moment as the overall technical lean is bullish, as shown by the recent pattern of higher ‘lows’ signaling the willingness of traders to currently buy on dips. A sustained break there with a fundamental boost could take the pair up to the R1 Pivot resistance area, which is statistically within reach this week based on the daily average true range of around 85 pips.
Of course, we have to take a look at the other side of the market in case we see a bearish Sterling and bullish Dollar fundamental scenario play out this week. If so, watch out for bearish reversal candles around the current market prices before planning out a short risk management play.
For the longer-term, the big idea on this pair is that if it sustainably breaks the range, it could draw in longer-term technical traders as well as fundamental position players.
A sustained upside break and retest of the top of the consolidation area around 1.2300 is the pattern to watch out for before considering a long risk management strategy, while a sustained break of the strong support area around 1.2100 is the area to watch before considering a short play.
A good practice with longer-term consolidation break plays is to use the other side of the range as the technical invalidation area of a strategy or idea, and given that the current range is about 200 pips, your targets should be around 400 to 600 pips to make this a worthwhile setup, which could take a month or two to play out if there is momentum.
What’s your take on this? Do you believe Cable will remain within a range for some time, prompting you to consider range plays?
Or are you anticipating a breakout from the consolidation? What’s your strategy if that happens?
We value your input, so feel free to drop a comment below and share your thoughts!