
Check out this classic pullback setup on EUR/JPY!
Is the trend still our friend or has it reached the bend at the end?
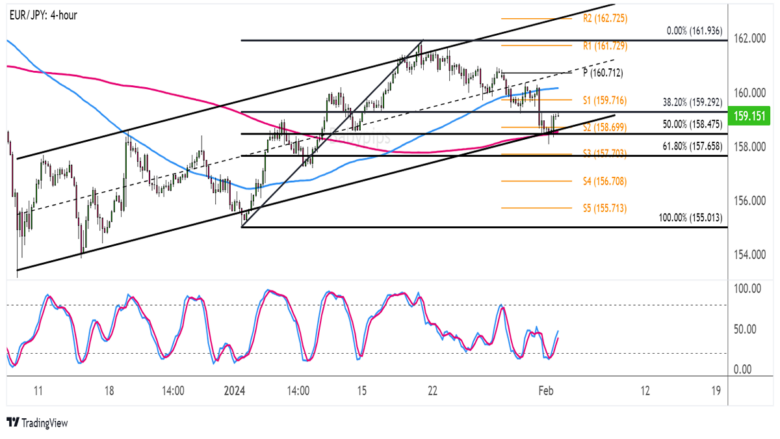
Here are the correction levels I’m watching on the 4-hour time frame.
EUR/JPY 4-hour Forex Chart by TradingView
Risk-off vibes have been propping up the safe-haven Japanese yen these days while the euro has been on the retreat after a somewhat dovish ECB statement last week.
Can a return in risk-taking still spur a bounce for this pair, though?
Remember that directional biases and volatility conditions in market price are typically driven by fundamentals. If you haven’t yet done your fundie homework on the euro and yen, then it’s time to check out the economic calendar and stay updated on daily fundamental news!
Price is currently hanging out at the bottom of the ascending channel that’s been holding all January, so euro bulls might decide to charge and defend this support region.
This happens to be right around the 50% Fib and S2 (158.70), which also coincide with the 200 SMA dynamic inflection point. I’m seeing a reversal candlestick pattern and confirmation from the next bars, so EUR/JPY might be well on its way to test the highs at R1 (161.73) or even the channel top closer to R2 (162.72) soon.
Don’t forget that the 100 SMA is above the 200 SMA to suggest that the uptrend is more likely to gain traction than to reverse. At the same time, Stochastic is already on the move up to indicate that bullish momentum is in play.
Just make sure you keep an eye out for a dip below the 61.8% Fib and S3 (157.70) since this might be an early signal of a reversal from the climb.
Oh, and remember to watch out for additional volatility and changes in market sentiment during the release of the highly-anticipated U.S. NFP report!