
This euro pair is still hanging out at the bottom of its triangle pattern after the ECB decision and U.S. inflation releases.
Recall that the U.S. CPI report beat market estimates while the ECB reinforced expectations of a June cut.
Will we see a breakdown soon?
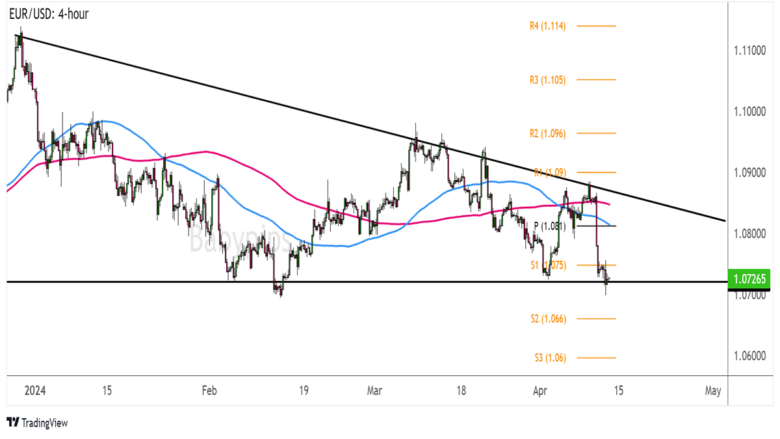
EUR/USD 4-hour Forex Chart by TradingView
EUR/USD has formed lower highs and found support around the 1.0725 mark, creating a descending triangle pattern visible on its 4-hour time frame.
Price got rejected on its test of resistance recently and dropped sharply to the bottom upon seeing stronger-than-expected U.S. CPI for March.
More confirmation that the ECB is likely to cut interest rates in June drove the shared currency lower, but dollar bears defended the triangle support yesterday when they saw a weaker-than-expected U.S. PPI data. After all, this report pointed to subdued inflationary pressures down the line.
Remember that directional biases and volatility conditions in market price are typically driven by fundamentals. If you haven’t yet done your fundie homework on the euro and the U.S. dollar, then it’s time to check out the economic calendar and stay updated on daily fundamental news!
With that, EUR/USD is still hanging out at the support region, still deciding whether to bounce or break lower. A bounce back above the 1.0750 minor psychological mark at S1 could pave the way for a move back up to the triangle top near the 1.0850 level and the dynamic resistance at the moving averages.
The 100 SMA is below the 200 SMA to suggest that the path of least resistance is to the downside, though, so there could be a case for a breakdown. If that happens, keep an eye out for a sustained bearish move to the next downside targets at S1 (1.0660) then S2 (1.0600).
Are there any potential catalysts that could still spur USD volatility before the week comes to a close?