
Basic Overview
Last Friday, gold prices rose after the release of the US non-farm payrolls report. The data showed a further slowdown in the labor market with the unemployment rate rising and wage growth declining. This led to lower real yields and accelerated the rise in gold. This has been the case for two years now where rising real yields lead to a much smaller decline in gold than falling real yields lead to a larger rise in gold.
So far, gold appears to be facing a limited downside but has plenty of upside potential as inflation slowly eases while risks to the growth picture increase as the Fed continues to impose its dovish policies. In the short term, strong US data may weigh on the market slightly, but in the long term, weak data is likely to trigger larger upside moves.
Technical Analysis of Gold – Daily Time Frame
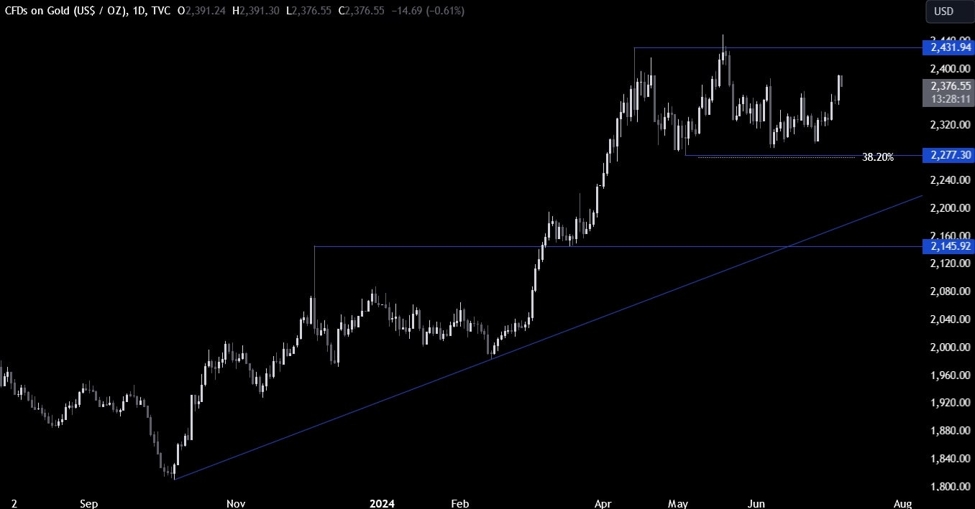
Gold daily
On the daily chart, we can see that gold has been on a steady rise since bottoming out near the key support of 2277 as buyers have piled in around the bottom of the range and are now looking towards the cycle high around the 2430 level. If the price reaches there, we can expect sellers to step in around the top of the range to pave the way for another drop to the 2277 support targeting a break below it.
Gold Technical Analysis – 4 Hour Time Frame
Gold 4 hours
On the 4-hour chart, we can see that the price rose to the 2387 resistance level after the weak US non-farm payrolls report and started to pull back. We now have a good support area around the 2368 level where we can also find the confluence of the previous high, the minor trend line and the 61.8% Fibonacci retracement level.
Here we can expect buyers to step in with a defined risk below the trend line to pave the way for a break of the 2387 resistance level. On the other hand, sellers will want to see the price break the 2277 resistance level to increase bearish bets towards the 2277 support level.
Technical Analysis of Gold – 1 Hour Time Frame
gold 1 hour
On the 1-hour chart, we can more clearly see the recent price action and bullish setup around the 2368 level. We can also see that we have the lower bound of the average daily range for today right around the support, so this should give buyers more confidence to rally around the 2370 level looking for a continuation of the uptrend.
Upcoming incentives
This week is a bit of a data-free week but we will still see some key economic releases. Tomorrow, Fed Chairman Powell will testify before Congress and markets will be focused on any view or hint on the path of monetary policy after the latest non-farm payrolls report. Thursday will be the most important day of the week as we will get the US CPI and US jobless claims numbers. Finally, on Friday, we will close out the week with the US PPI and the University of Michigan Consumer Sentiment Survey.