
The US dollar may be ready for a sharp rally after seeing a bearish trend earlier this month.
Do you think the US dollar is ready to rise?
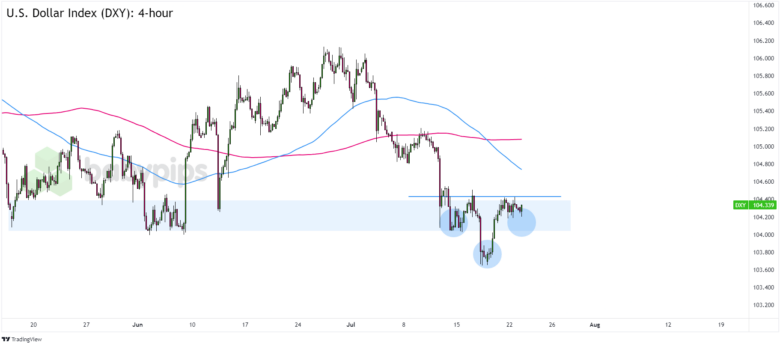
Take a look at the reversal pattern on the 4-hour chart!
US Dollar Index (DXY) 4-hour Chart by TV
Days after retesting the lows of April and June, the US dollar may be poised for an upward trajectory.
Why not? Weak growth readings in some major economies and a surprise interest rate cut by the People’s Bank of China highlight the Fed’s relatively less dovish stance and the dollar’s safe-haven status.
Rising US bond yields and US stock prices could also attract bullish demand and push the US dollar higher.
But are these measures enough to push the currency index higher?
Remember that directional biases and volatility in market prices are usually driven by fundamentals. If you haven’t done your homework on the US dollar yet, it’s time to take a look at the economic calendar and stay up to date with the daily fundamental news!
As you can see, the USDX pair is showing a potential inverse head and shoulders pattern on the 4-hour time frame after a strong decline that started in late June.
Bullish candles and continued trading above the “neckline” at 104.40 open the way for the index to return to the psychological level of 105.00 if not the June highs at 106.00.
On the other hand, dollar pessimists may be taking a breather and will soon be factoring in future rate cuts by the Fed.
If the USDX pair finds resistance at the “neckline” of the pattern and trades lower, the dollar could drop back to the July lows at 103.80 or even drop to the March turning point at 103.00 – 103.50.
Good luck and happy trading with this pattern!