
When technical levels overlap and you find sellers (or buyers) leaning towards that level, this should give traders the impression that it is a “key risk-focused level.” This means that if the price cannot get back above that level, sellers (or buyers) are in control of the market.
Furthermore, if multiple time frames (i.e. daily, 4-hour, hourly, etc.) have technical levels converging at the same level, this makes that level even more important.
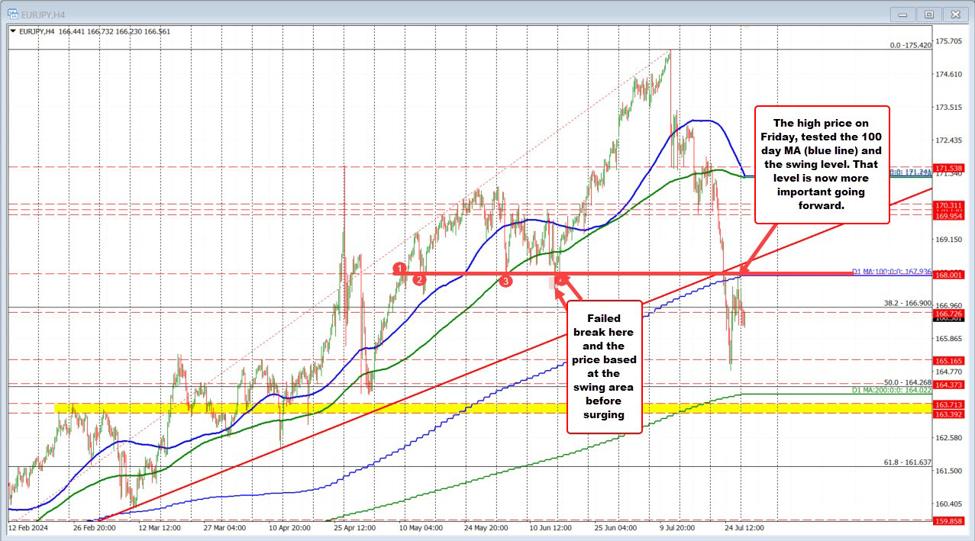
In EUR/JPY, the 100-day moving average and the swing area near 162.93 converged on Friday. When the Friday correction high reached this level, sellers took up the level and pushed the price lower (see chart below).
Looking at the hourly chart below, the 100-hour moving average was also close to the 100-day moving average on Friday. So not only did the 100-day moving average and the swing high provide price resistance, but the 100-hour moving average also stopped the rally (see blue circle 5 on the chart below). This added to the sellers on Friday.
The 100-hour moving average (blue line on the chart below) is now lower, and in today’s trading, the rally in the Asian session has stalled in front of the moving average level (see blue circle 6 on the chart below).
So, the 100-hour moving average at 167.05 is a closer level to define risk/bias. If we move above it, the short-term bias is modestly tilted to the upside with work to be done. The “work to be done” (or work in progress) is to break above the 100-day moving average and the swing level near 167.93.
By building the technical case on multiple charts, traders can find the pattern that shows the roadmap for sellers (or buyers depending on the direction the market is taking). For the EUR/JPY pair, the 100-hour moving average is important. The 100-day moving average and the swing level are also important. As a result, they are part of the roadmap for your trading.
As long as the price remains below those levels, the path forward is down. If the 100-hour moving average is broken, the price bias has shifted and is pointing up. If the 100-day moving average/swing level is broken, the roadmap now says, “Up.”
Follow the technical roadmap, it will show you the way.