
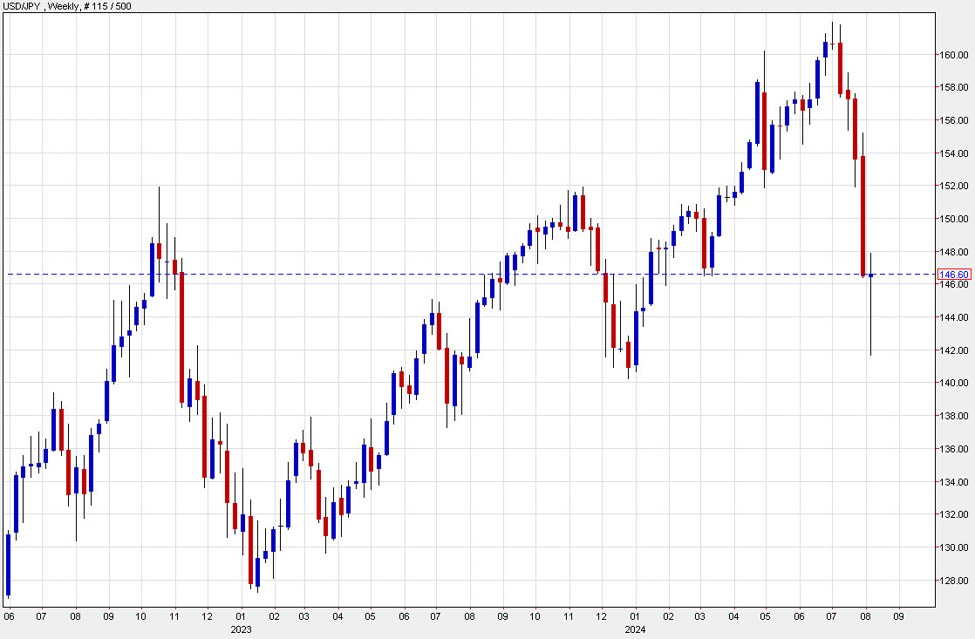
USD/JPY Weekly
What is in the 19 point movement?
This is the overall change in the USD/JPY pair on the weekly chart. Of course, this doesn’t tell the whole story, not even close. The pair has collapsed after hitting a 34-year high last month, and was down more than 20 big figures by Monday.
The drop came as the carry trade collapsed, leading to the biggest one-day loss in the history of the Nikkei 225. The drop also shook global markets, sending shock waves almost everywhere.
Markets began to calm down on Tuesday, in part because the Bank of Japan signaled that it was done raising interest rates — giving traders the green light to return to the market and re-inflate the bubble.
This pullback in position coupled with incredibly oversold conditions has led to a quick recovery in the pair which had been floundering until the last few hours when there was some selling, partly due to US Treasury yields falling sharply and completely shaking off inflation concerns. It’s a mixed picture but the slowing US economy is part of the story in this pair’s decline and will likely tell the next chapter in this pair.
Next week we will get CPI and retail sales data from the US and if the message is more of a slowdown, we could see this stalemate break quickly. If the US consumer continues to find more strength and the overall risk sentiment remains positive, we could quickly return to the 150.00 level.
Technically, the large doji candle on the weekly chart raises the possibility of another reversal, which is a good bet given how far things have moved but only works in a benign risk environment.
Comments are closed, but trackbacks and pingbacks are open.