
In the video earlier this morning, I highlighted the 1.3348 level as a key bearish gauge for GBP/USD today. A move below this level would be more bearish. Holding above it would be more bullish. Here is the reference for this level:
Looking at the current hourly chart below, the 100-hour moving average has been tested on three separate hourly bars in the US session. Each time, buyers have taken up the risk-defining level. The last level has now led to a rally to 1.34175. Yesterday’s high was 1.34291. These levels are the highest since February 2024 for GBP/USD.
The holding of the 100-hour moving average also increases the importance of this level in the future for traders at least in the short term. For traders who are bullish on the GBP/USD pair, a break of it should be a stop loss. I expect that if it breaks today, buyers will be disappointed by the failure.
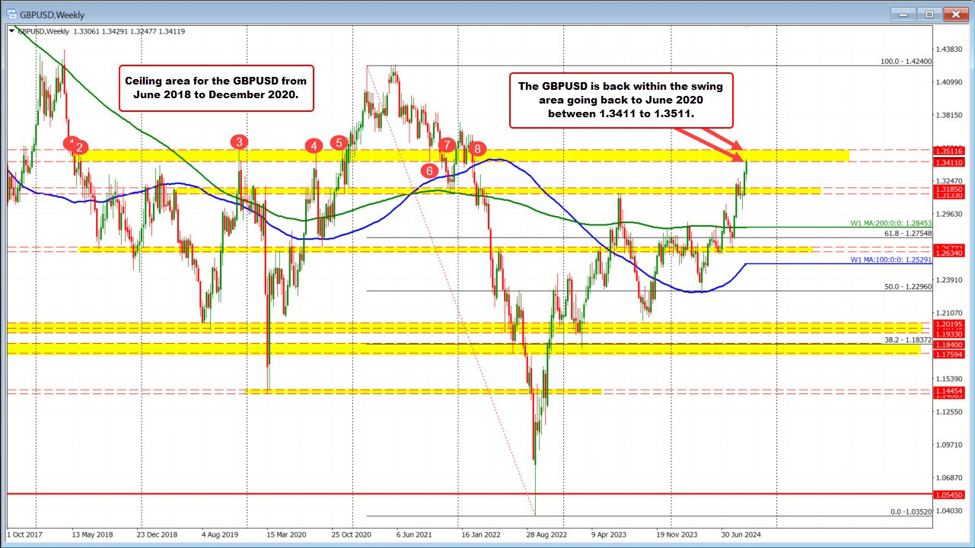
Looking at the weekly chart below, the price is currently trading within a swing zone between 1.3411 and 1.3511. This swing zone only dates back to the period from June 2018 to December 2020, where it provided a ceiling for the pair.
With more bullish momentum, the 1.3511 level is the next major target level that buyers need to reach and break for further gains.
Comments are closed, but trackbacks and pingbacks are open.