
Bitcoin has broken out of a long-term triangle pattern to indicate that a major trend is underway.
Where could BTC/USD go next?
Take a look at these potential targets I see on the daily time frame!
Bitcoin (BTC/USD) Chart by TradingView
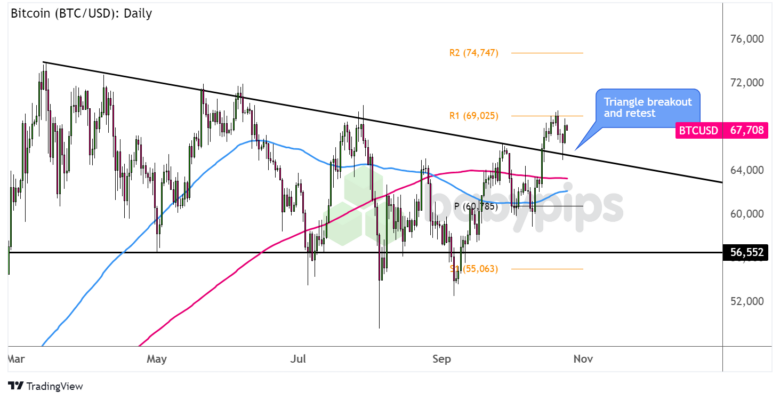
A combination of risk-on and anti-USD action on election-related uncertainty allowed Bitcoin to rally above a bearish triangle chart pattern that had been holding since March of this year.
The rally hit a barrier at R1 ($69,025) near a key psychological mark, forcing BTC/USD to retest previous triangle resistance, which appears to be holding as support.
Could Bitcoin target new highs from here?
Remember that directional biases and volatility conditions in market prices are usually driven by fundamentals. If you haven’t done your homework on Bitcoin and USD yet, it’s time to check the economic calendar and stay up to date with daily fundamental news!
Beating the recent highs could pave the way for a climb to the next potential upside target at R2 ($74,747) which is just above Bitcoin’s all-time highs.
However, the 100 SMA is still below the 200 SMA to reflect the presence of bearish reactions, which could bring BTC/USD back inside the triangle and test support areas in the near term. If that happens, stay on the lookout for declines to the pivot point level ($60,785) or a pullback to the bottom of the triangle around $56,000.
As always, pay attention to headlines that can impact overall market sentiment and be sure to practice proper position sizing when making any trades!
This content is intended for informational purposes only and does not constitute investment advice. Trading in any financial market involves risks. Please read our risk statement to ensure you understand the risks involved.
Comments are closed, but trackbacks and pingbacks are open.