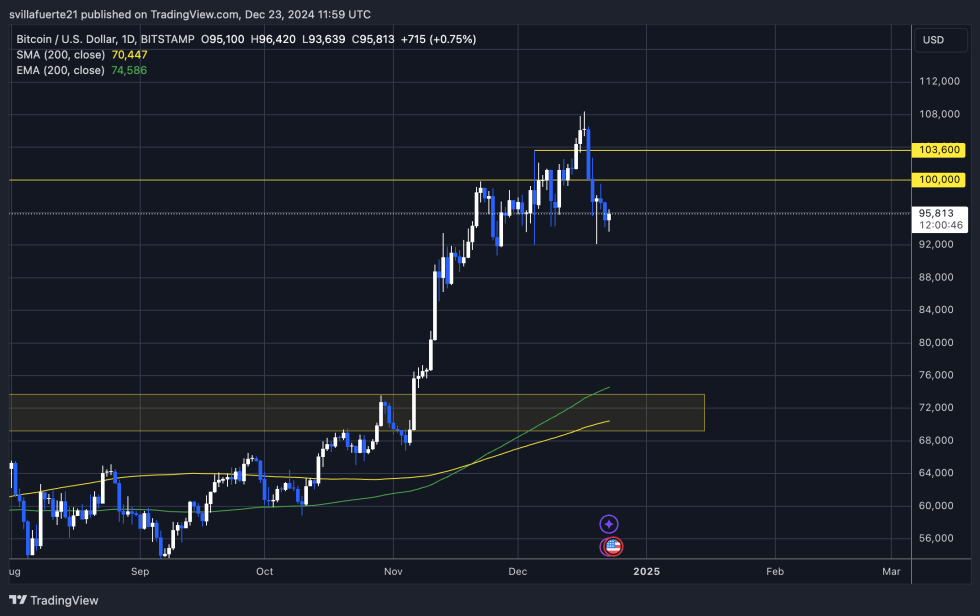
Bitcoin suffered days of disappointing price action, falling from an all-time high of $108,364 to a local low of $92,100. Despite this sharp decline, the price structure remains bullish, sparking optimism among analysts and traders who believe that Bitcoin’s rise could resume at any moment. Market sentiment appears cautious but optimistic, with many looking to key support and resistance levels to confirm the next major move.
CryptoQuant analyst Axel Adler recently shared interesting data about X, shedding light on Bitcoin’s current trading dynamics. According to Adler, the average daily trading volume on central exchanges (CEX) is currently $31 billion – well below the record highs of $40 billion recorded in March and December of this year. This decline in trading activity indicates that market participants are waiting for clearer signals before committing to large positions.
The decline in trading volume highlights a potential consolidation and accumulation environment as BTC continues to hold above critical support levels. With bullish sentiment remaining intact and on-chain metrics pointing to strong fundamentals, the coming days could provide pivotal insights into Bitcoin’s trajectory. Investors are now closely monitoring the price action for signs of renewed momentum as the market prepares for what could be the next phase of Bitcoin’s uptrend.
The metrics point to a steady rise
Bitcoin is going through a period of consolidation below its all-time high, and many investors have felt a sense of uncertainty, wondering if the top of the cycle has already arrived. This fear has been exacerbated by the recent price decline, but key metrics suggest there is still plenty of room for growth and demand in the market. The current price action may appear bearish to some, but fundamental data indicates a continued bullish outlook in the near term.
Senior analysts Axel Adler recently shared insightful data about XHe revealed that the average daily trading volume on central exchanges (CEX) currently stands at $31 billion, which is $9 billion lower than the record highs recorded in March and December this year.
Despite this decrease in volume, it indicates that the market is in a consolidation phase and not in a full contraction phase. Additionally, ETF trading volumes remain strong, averaging $4.4 billion per day, with a peak of $6.7 billion reached in March. Together, these metrics total an average of $35.5 billion in daily trading volume, reflecting significant market activity.
Now, consider the scenario where traditional finance (TradFi) never entered the space. In such a scenario, the market would likely continue as it has in the past – driven by futures and spot market activity during the peak of the cycle.
TradFi’s participation has undoubtedly added liquidity, but it has not fundamentally changed the normal market dynamics. The fact that Bitcoin continues to enjoy healthy trading volume suggests that the bull market may not be over yet.
Bitcoin contract is strong above $95,000
Bitcoin is currently holding above the crucial level of $95,000, a key price point for determining short-term trend. This level has been an important support area, and if BTC can maintain its position above $95,000 in the coming days, a push towards the $100,000 mark is expected. This potential upward move could indicate that the bulls are regaining control and preparing to challenge their previous all-time highs.

However, if BTC fails to hold above $95k and loses this level of support, it will likely send the price to test lower demand areas. In this scenario, the next important support level is around $92,000, which could serve as a crucial test of market strength. A break below this mark will increase the likelihood of a deeper correction, with Bitcoin potentially moving towards lower levels.
The coming days will be crucial for Bitcoin, as maintaining support above $95,000 is vital to maintain bullish momentum and avoid further downward pressure. The market is still in a delicate balance, and the next move may determine whether Bitcoin continues its rise or faces a more significant pullback.
Featured image by Dall-E, chart from TradingView
