

Bitcoin’s (BTC) crucial momentum indicator turned positive, as the leading cryptocurrency attracted more than $2.1 billion in weekly net ETF inflows.
Is a new Bitcoin on the horizon?
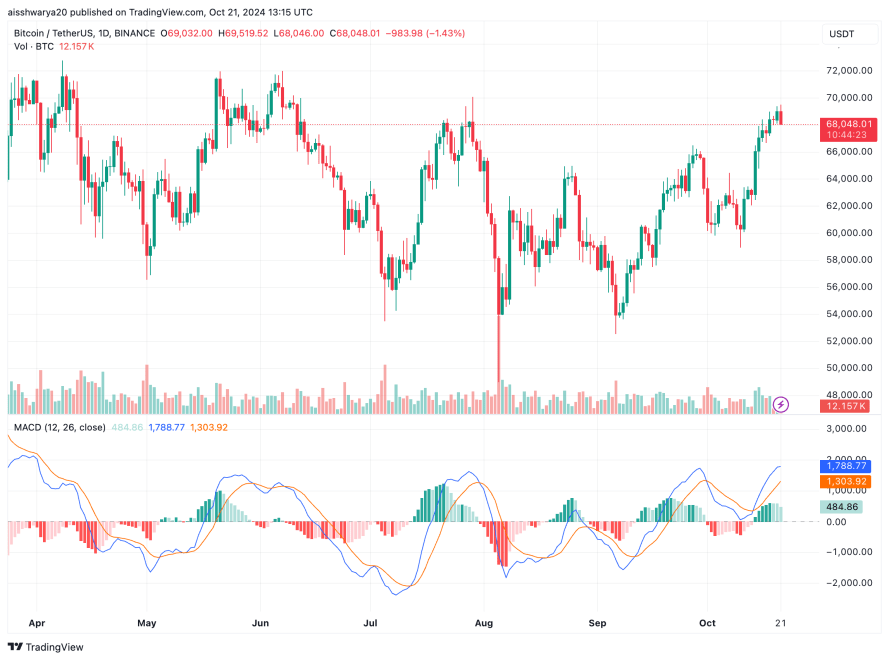
Bitcoin may be heading for a new all-time high (ATH), as the Moving Average Convergence Divergence (MACD) histogram has turned positive on the weekly chart for the first time since April 2024.
For starters, the MACD histogram is a crucial momentum indicator that is widely used to measure the future price of an underlying asset. The indicator helps traders identify shifts in momentum, as positive values indicate upward momentum and negative values indicate downward momentum.
The MACD indicator is calculated by subtracting Bitcoin’s 26-week moving average from its 12-week moving average. Furthermore, a signal line is generated by averaging the MACD over a period of nine weeks, and the difference between the MACD and the signal line is displayed as a histogram.
It is worth noting that the rise of the MACD histogram reflects the strength of the trend, which helps in identifying potential buy or sell points in the market. In the chart below, the MACD is shown having remained in the red since April 2024.
In the context of BTC, the recent positive change in the MACD histogram indicates an increased buying interest in the market. It indicates that Bitcoin’s short-term price trend is gaining strength compared to its long-term trend, indicating a potential upward movement beyond the ATH value of $73,737 in March 2024.
The MACD shift to the upside aligns well with other positive macroeconomic developments, including the US Federal Reserve’s (Fed) decision to cut key interest rates to stimulate business spending. Cryptanalysis He predicts Further rate cuts will give BTC the ammunition it needs to rally in Q4 2024.
Bitcoin spot ETFs record $2.1 billion in weekly net inflows
Another factor painting a bullish picture for the leading digital asset is the return of strong positive weekly flows into US spot BTC ETFs.
according to Data From SoSoValue, weekly net inflows into spot BTC ETFs for the week ending October 18 totaled $2.13 billion. This represents the highest total weekly net inflows since $2.6 billion in March 2024, when BTC achieved a new ATH of more than $73,000.
As of October 18, the cumulative net inflow of Bitcoin ETFs in the US was US$20.94 billion, with total net assets of US$66 billion, equivalent to approximately 4.9% of the total Bitcoin market cap.
since consent By the US Securities and Exchange Commission (SEC) earlier this year, many institutional investors have gravitated towards Bitcoin ETFs.
Wall Street giant Morgan Stanley recently open It had $272 million in BTC ETF holdings, denoting about 2% of its total assets under management.
but, decrease Interest in Bitcoin – evidenced by the decline in search volume for Bitcoin-specific keywords on Google – indicates that retail sector participants remain hesitant to invest in Bitcoin due to its perceived volatility. BTC is trading at $68,048 at press time, down 1.2% over the past 24 hours.
Featured image from Unsplash.com, charts from TradingView.com