
The recovery in risk appetite has sent volatile assets like Bitcoin higher against the US dollar!
The BTC/USD pair just bounced off the technical support area and looks ready to test a major turning point.
Will the crypto pair continue its gains today?
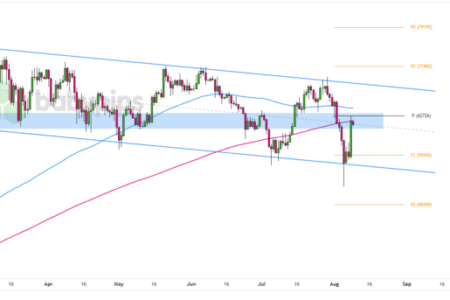
Bitcoin (BTC/USD) Daily Chart by TradingView
If you missed yesterday’s market action, you should know that the better-than-expected US labor market report encouraged risk-taking in the markets.
Safe-haven appetite for the US dollar has declined while “risk” assets like Bitcoin have risen.
Remember that directional biases and volatility in market prices are usually driven by fundamental factors. If you haven’t done your homework on Bitcoin and the US Dollar yet, it’s time to take a look at the economic calendar and stay up to date with the daily fundamental news!
The BTC/USD pair, which was hovering around the $55,000 level, rose to $61,000 levels before sellers stepped in.
Will the bulls maintain their momentum in the next few days?
In a bullish scenario, we may see the BTC/USD pair break the current resistance set. This may pave the way for a move towards the $70,000 psychological level, the R1 pivot point at $71,902, with the upper boundary of the channel and the R2 pivot point at $79,192 as the next targets.
On the flip side, if sellers regain control, we could see a pullback towards S1 at $55,436 near the August lows and descending channel support. Sustained trading below this level could signal a deeper correction, which could retest the recent lows near S2 at $46,260.
Whatever bias you choose to adopt in trading, remember that proper risk management is crucial when trading volatile assets like cryptocurrencies. Stay up to date with regulatory developments and broader market sentiment, as these factors can significantly impact cryptocurrency prices.