
This commodity is still stuck in consolidation, as it hovers close to the ascending triangle top.
Can it go for a breakout soon?
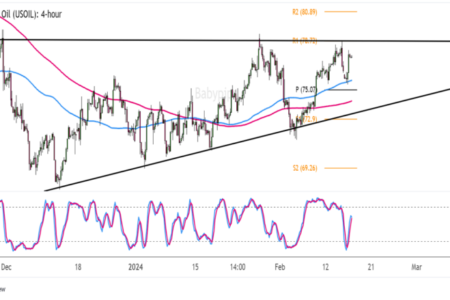
Here are the inflection points I’m watching on the 4-hour time frame.
WTI Crude Oil (USOIL) 4-hour Chart by TradingView
A larger than expected build in inventories prevented WTI crude oil from busting above its triangle resistance earlier this week, as stockpiles rose by 12.2 million barrels versus the projected increase of 3.3 million barrels.
However, the commodity seems ready to attempt another break higher, as it filled the bearish gap and is now setting its sights back on the ascending triangle top again.
Remember that directional biases and volatility conditions in market price are typically driven by fundamentals. If you haven’t yet done your fundie homework on crude oil, then it’s time to check out the economic calendar and stay updated on daily fundamental news!
If crude oil manages to close above the triangle resistance that coincides with R1 ($78.72 per barrel) it may be in for a rally that’s the same height as the formation.
Technical indicators are reflecting the presence of bullish vibes, as the 100 SMA is above the 200 SMA while Stochastic is already on the move up.
The oscillator has room to climb before reaching the overbought area to reflect exhaustion among buyers, so the commodity might keep following suit. Also, the moving averages are near the pivot point level ($75 per barrel) and might hold as dynamic support on dips as well.
Whichever bias you end up trading, make sure to use trading plans and to execute your best risk management skills!