Most Read: Gold Price Forecast – Core PCE Data to Guide Markets Ahead of Fed Decision
The U.S. Bureau of Economic Analysis will release on Friday core personal consumption expenditures data, the Fed’s favorite inflation gauge. The strength or weakness of the report relative to Wall Street’s consensus estimates is likely to shape the U.S. dollar’s near-term trajectory and possibly influence the FOMC’s guidance at its January meeting next week.
In terms of estimates, core PCE is forecast to have risen 0.2% in December, bringing the annual rate down to 3.0% from 3.2% in November – a step in the right direction for policymakers, who have embarked on a historic streak of interest rate hikes to restore price stability in the post-pandemic period.
For the U.S. dollar to continue its recent recovery, PCE numbers need to show that progress on disinflation is stalling. In this scenario, the Fed may be hesitant to cut borrowing costs substantially and may even delay the start of the easing cycle by several months.
In the event of a subdued core PCE reading below 3.0%, the greenback could take a sharp turn to the downside. Weak inflation numbers could help validate the market pricing of deep interest rate cuts, pushing Treasury yields lower – an outcome poised to reduce the attractiveness of the U.S. currency.
For an extensive analysis of the euro’s medium-term prospects, download our Q1 technical and fundamental forecast. The trading guide is free!
Recommended by Diego Colman
Get Your Free EUR Forecast
EUR/USD TECHNICAL ANALYSIS
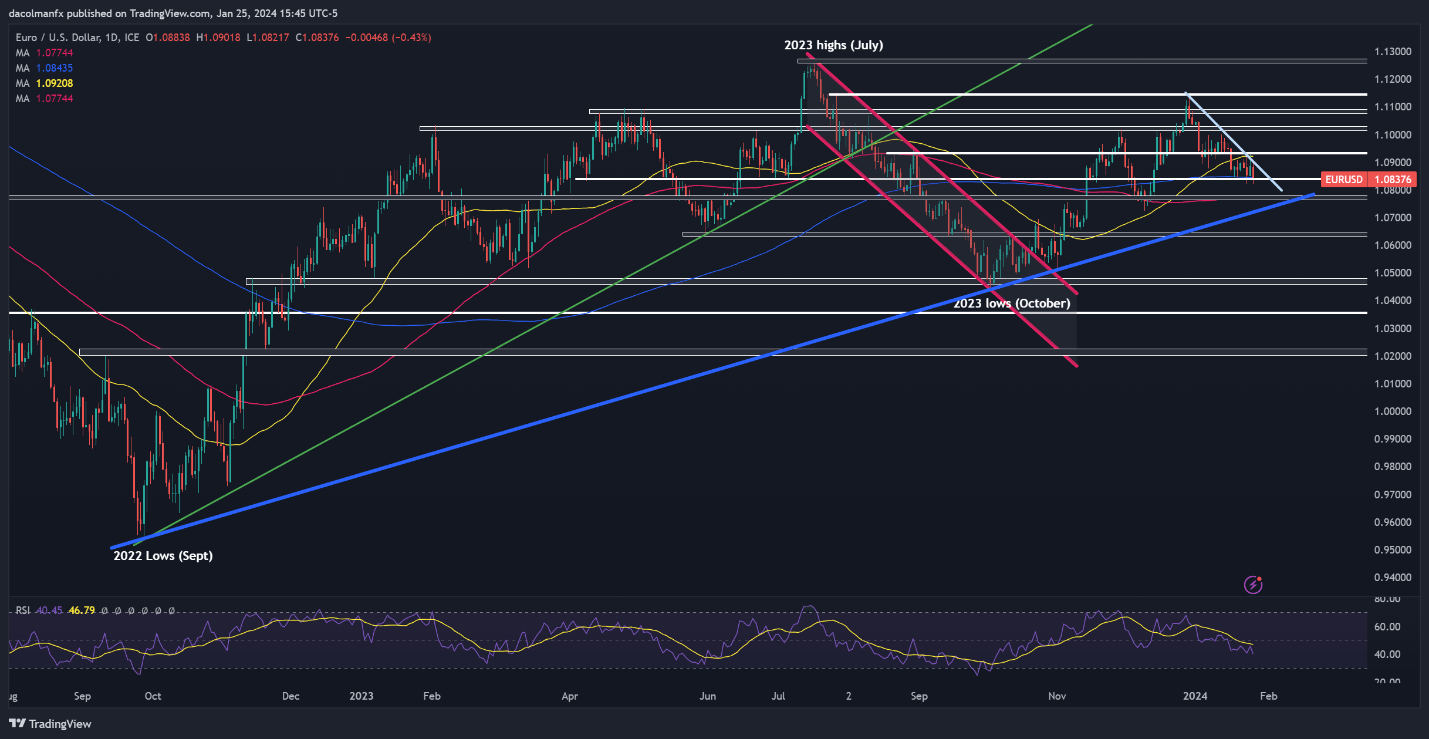
EUR/USD fell on Thursday, slipping below its 200-day simple moving average near 1.0840. If prices fail to reverse higher and close below this level for the week, we could see a pullback towards 1.0770 over the next few trading sessions. On further weakness, all eyes will be on trendline support near 1.0710.
In the event of a market turnaround and push above the 200-day SMA, initial resistance appears at 1.0880, followed by 1.0920/1.0935. The bullish camp might encounter challenges in driving prices beyond this technical barrier, yet a successful breakout could pave the way for a move towards 1.1020.
EUR/USD TECHNICAL CHART
EUR/USD Chart Created Using TradingView
For a complete overview of the pound’s outlook over the next three months, make sure to download our complimentary quarterly forecast!
| Change in | Longs | Shorts | OI |
| Daily | 10% | -7% | 0% |
| Weekly | -3% | -7% | -5% |
GBP/USD TECHNICAL ANALYSIS
GBP/USD retreated on Thursday after failing to clear the upper limit of a symmetrical triangle, a continuation pattern that has been developing since the middle of last month. For context, this technical setup is validated once prices move outside the boundaries of the triangle, with the confirmation signal carrying greater strength if the breakout occurs in the direction of the prevailing trend.
In the case of GBP/USD, traders should watch two areas in the coming days and weeks: resistance at 1.2750/1.2770 and support at 1.2620/1.2600. A breach of resistance could pave the way for a rally towards 1.2830 and, potentially, 1.3000. Conversely, a move below support could expose the 200-day simple moving average and, in the most extreme case, lead to a pullback towards 1.2455.
GBP/USD TECHNICAL CHART
GBP/USD Chart Created Using TradingView
Eager to gain insights into gold‘s outlook? Get the answers you are looking for in our complimentary quarterly trading guide. Request a copy now!
Recommended by Diego Colman
Get Your Free Gold Forecast
GOLD PRICE TECHNICAL ANALYSIS
Following a decline to multi-week lows last week, gold has found stability in recent days amid lower volatility, with prices confined between trendline resistance at $2,030 and horizontal support at $2,005. Breaking through these technical thresholds is essential for meaningful directional moves; otherwise, consolidation becomes the most probable scenario.
Evaluating possible outcomes, a topside breakout could propel XAU/USD towards $2,065. On further gains, we could witness a rally towards $2,080. On the flip side, if a bearish breakdown occurs, support emerges at $1,990 and $1,975 thereafter. Continued losses hereon out could bring the 200-day simple moving average into focus.

