
The GBP/USD pair rose during the day in sympathy with the dollar selling after the weaker US jobs report.
However, the move to the upside found willing sellers near the 1.2644-1.2667 swing target area. This area has capped previous gains this week ahead of the Bank of England’s interest rate cut on Thursday.
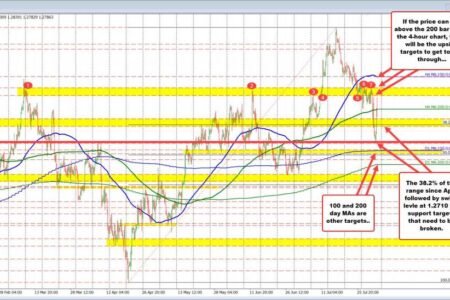
The price has since declined and returned below the 200-bar moving average on the 4-hour chart at 1.28042. This moving average will act as a gauge for buyers and sellers in the short term.
If the price manages to stay below this moving average, the 38.2% of the range since the April low at 1.2759 will be the next downside target. If the price moves below this level, the weekly low near 1.2710 will be targeted ahead of the 100-day moving average and the 200-day moving average at 1.2683 and 1.2646 respectively.
If the pair manages to break the 2000-bar moving average, followed by the aforementioned swing zone between 1.28449 and 1.2867, the now falling 100-bar moving average on the 4-hour time frame will target just below the natural resistance at 1.2900.