GOLD, EUR/USD, NASDAQ 100 FORECAST
- Gold prices, EUR/USD and the Nasdaq 100 will be highly sensitive to the upcoming U.S. inflation report
- The U.S. Bureau of Labor Statistics will release October consumer price index data on Tuesday
- Headline CPI is seen rising 0.1% m-o-m and 3.3% y-o-y. Meanwhile, the core gauge is expected to clock in at 0.3% m-o-m and 4.1% y-o-y
Trade Smarter – Sign up for the DailyFX Newsletter
Receive timely and compelling market commentary from the DailyFX team
Subscribe to Newsletter
Most Read: US Dollar Outlook Hinges on US Inflation, Setups on EUR/USD, USD/JPY, AUD/USD
The U.S. Bureau of Labor Statistics will release consumer price index numbers on Tuesday morning. With the Federal Reserve hypersensitive to incoming information and cognizant of upside inflation risks, the latest CPI report will carry additional weight in the eyes of financial markets. This could mean more volatility for gold prices, EUR/USD, and the Nasdaq 100 in the trading sessions ahead.
In terms of estimates, headline CPI is forecast to have risen 0.1% on a seasonally adjusted basis in October. This should push the annual rate to 3.3% from 3.7% previously. Meanwhile, the core gauge, which excludes food and energy, is seen rising 0.3% in monthly terms, with the 12-month related reading unchanged at 4.1%.
UPCOMING US DATA
Source: DailyFX Economic Calendar
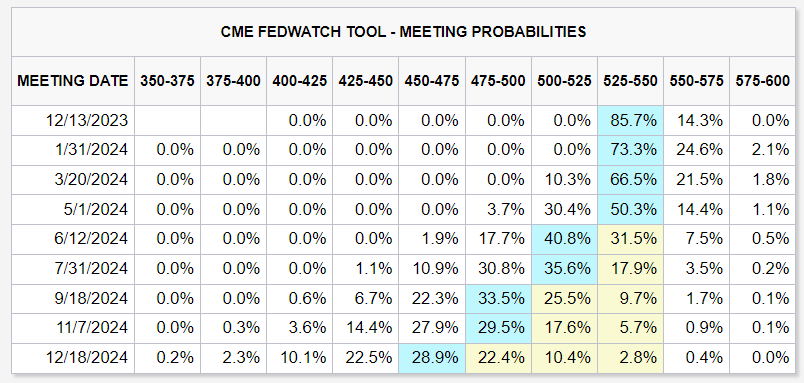
The Fed has embraced a data-centric stance and noted that it will “proceed carefully”. Despite this cautious approach, the institution has not entirely closed the door to additional policy firming, with Chair Powell indicating that officials are not confident that they have achieved a sufficiently restrictive stance to return inflation to 2.0% and that further progress on cooling price pressures is not guaranteed.
Taken together, Powell’s comments suggest that the FOMC is not on a pre-set course and is ready to respond as appropriate to adverse developments that may hinder the fulfillment of its mandates. In this context, any upward deviation of the October CPI figures from consensus expectations could lead policymakers to favor another rate hike at one of their upcoming meetings.
FOMC MEETING PROBABILITIES
Source: CME Group
If interest rate expectations shift in a more hawkish direction on account of a hot CPI report, U.S. yields should rise, boosting the U.S. dollar. This, in turn, might exert downward pressure on gold, the Nasdaq 100, and EUR/USD. The opposite is also true; a downside surprise in last month’s inflation data should support precious metals, tech stocks, and the EUR/USD by restraining yields and undermining the higher-for-longer argument.
Eager to gain insights into gold’s future path and the catalysts that could spark volatility? Discover the answers in our Q4 trading forecast. Get the free guide now!
Recommended by Diego Colman
Get Your Free Gold Forecast
GOLD PRICE TECHNICAL ANALYSIS
Gold reversed lower this month after failing to clear a key ceiling in the $2,010/$2,015 region. Following this pullback, the metal is nestled around the 200-day simple moving average, fluctuating in proximity to it. If prices resolve to the upside and consolidate above this technical indicator in a decisive fashion, initial resistance appears at $1,980, followed by $2,010/$2,015.
On the flip side, should sellers reemerge and reignite downward pressure, the initial floor to watch rests at $1,935, located just above the 50-day simple moving average. While gold might establish a foothold in this area on a retrenchment, a breach to the downside could trigger a drop towards $1,920. Below this threshold, attention shifts to $1,900.
GOLD PRICE CHART (FUTURES CONTRACTS)
Gold Price Chart Created Using TradingView
Curious about the expected trajectory for EUR/USD and the market drivers that should be on your radar? Discover key insights in the Q4 euro’s trading guide!
Recommended by Diego Colman
Get Your Free EUR Forecast
EUR/USD TECHNICAL ANALYSIS
After encountering resistance at a Fibonacci level at 1.0765, EUR/USD has conceded ground, with prices now hovering above the lower limit of a support range near 1.0650. Maintaining this floor is imperative for the bulls; a failure to do so might result in the exchange rate heading towards trendline support at 1.0555. Continued weakness increases the risk of revisiting the 2023 lows.
Shifting the focus to a bullish outlook, if sentiment sees a sustained upturn and the bulls reassert control in the market, initial resistance is situated at 1.0765, an area where the 200-day simple moving average converges with the 38.2% Fibonacci retracement of the July/October slump. A successful breakout of this ceiling has the potential to bolster the upward pressure, leading to a rally towards 1.0840.
EUR/USD TECHNICAL CHART
EUR/USD Chart Created Using TradingView
If you’re looking for in-depth analysis of U.S. equity indices, our Q4 stock market trading forecast is packed with great fundamental and technical insights. Download it now!
Recommended by Diego Colman
Get Your Free Equities Forecast
NASDAQ 100 TECHNICAL ANALYSIS
The Nasdaq 100 broke out to the topside last week, clearing cluster resistance in the 15,400-15,500 area. If the breakout is sustained and the tech index remains above this range, which now represents technical support, we could see a move towards September’s high at 15,720. On further strength, the focus transitions to the 2023 peak at 16,062.
Conversely, if sellers resurface and the bulls start to liquidate their long positions to book profits on fears of a potential correction following the recent bullish run, initial support lies at 15,500/15,400. Should this floor cave in, we could witness a pullback towards 15,200, followed by 14,850. Prolonged weakness increases the likelihood of a drop towards 14,600.

