US Dollar, Euro, British Pound vs. Japanese Yen – Outlook:
- USD/JPY is once again testing the psychological 150 mark.
- Risk of intervention is growing amid speculation of a tweak in BOJ YCC policy.
- What is the outlook and what are the key levels to watch in select JPY crosses?
Looking for actionable trading ideas? Download our top trading opportunities guide packed with insightful tips for the fourth quarter!
Recommended by Manish Jaradi
Get Your Free Top Trading Opportunities Forecast
The Japanese yen is retesting the psychological 150 mark against the US dollar ahead of the Bank of Japan’s policy meeting next week.
USD/JPY is within the zone that prompted the BOJ to intervene last year, a possibility highlighted in September – see “Japanese Yen Tumbles as BOJ Maintains Status Quo: USD/JPY Eyes 150,” published September 22. Japanese finance minister Shunichi Suzuki said on Thursday authorities are closely watching moves with a sense of urgency and warned investors against selling the yen.
USD/JPY Daily Chart
Chart Created by Manish Jaradi Using TradingView
BOJ’s ultra-easy monetary policy contrasts with its peers where central banks have tightened monetary policy at an unprecedented pace to tackle inflation, pressuring the yen. Rising global yields and inflation have pushed Japanese yields higher, putting pressure on the BOJ to tweak its yield curve control (YCC) policy, which the central bank uses to manage yields. The Japanese central bank tweaked the YCC policy a few months ago to allow for greater flexibility, and it could further adjust the policy when it meets next week.
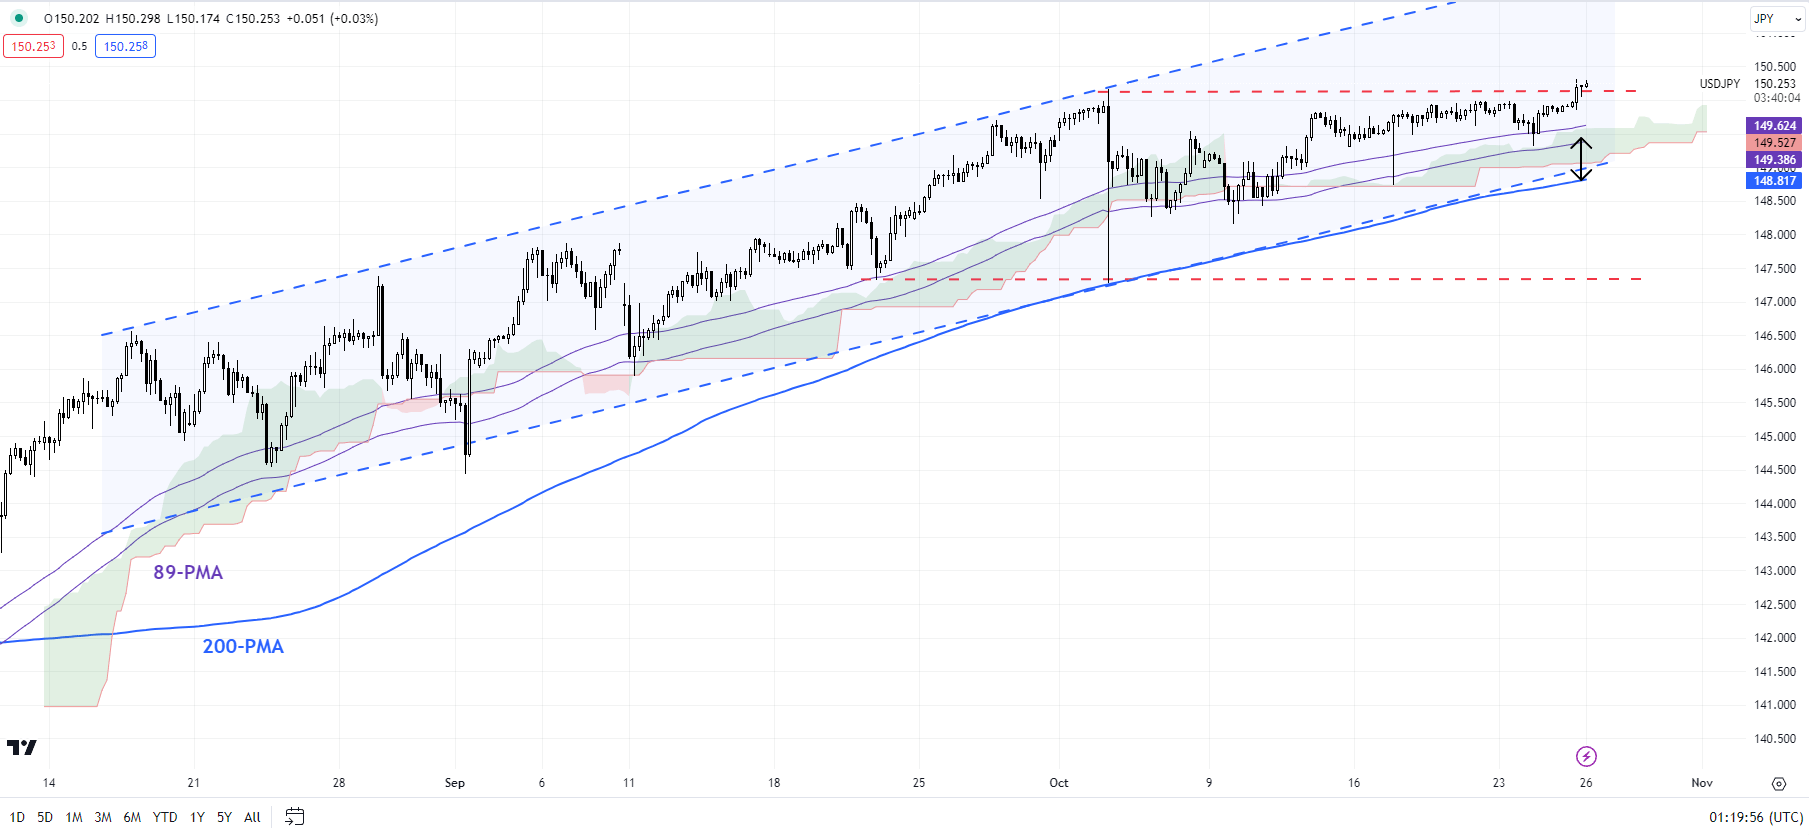
USD/JPY 240-Minute Chart
Chart Created by Manish Jaradi Using TradingView
Discover the power of crowd mentality. Download our free sentiment guide to decipher how shifts in USD/JPY’s positioning can act as key indicators for upcoming price movements.
Recommended by Manish Jaradi
Improve your trading with IG Client Sentiment Data
USD/JPY: Flirts with psychological 150
USD/JPY is once again retesting the psychological 150 mark, slightly below the 2022 high of 152.00. There is no sign of a reversal of the uptrend – the pair continues to make higher highs and higher lows, albeit gradually. USD/JPY continues to hold above the 200-period moving average (at about 148.75) on the 240-minute chart, around Tuesday’s low of 149.25. A break below 148.75-149.25 would confirm that the upward pressure had faded in the interim. For a more sustained consolidation to occur, USD/JPY would need to crack under the early-October low of 147.35. On the upside, a decisive break above 150.00-152.00 could open the door toward the 1990 high of 160.35.
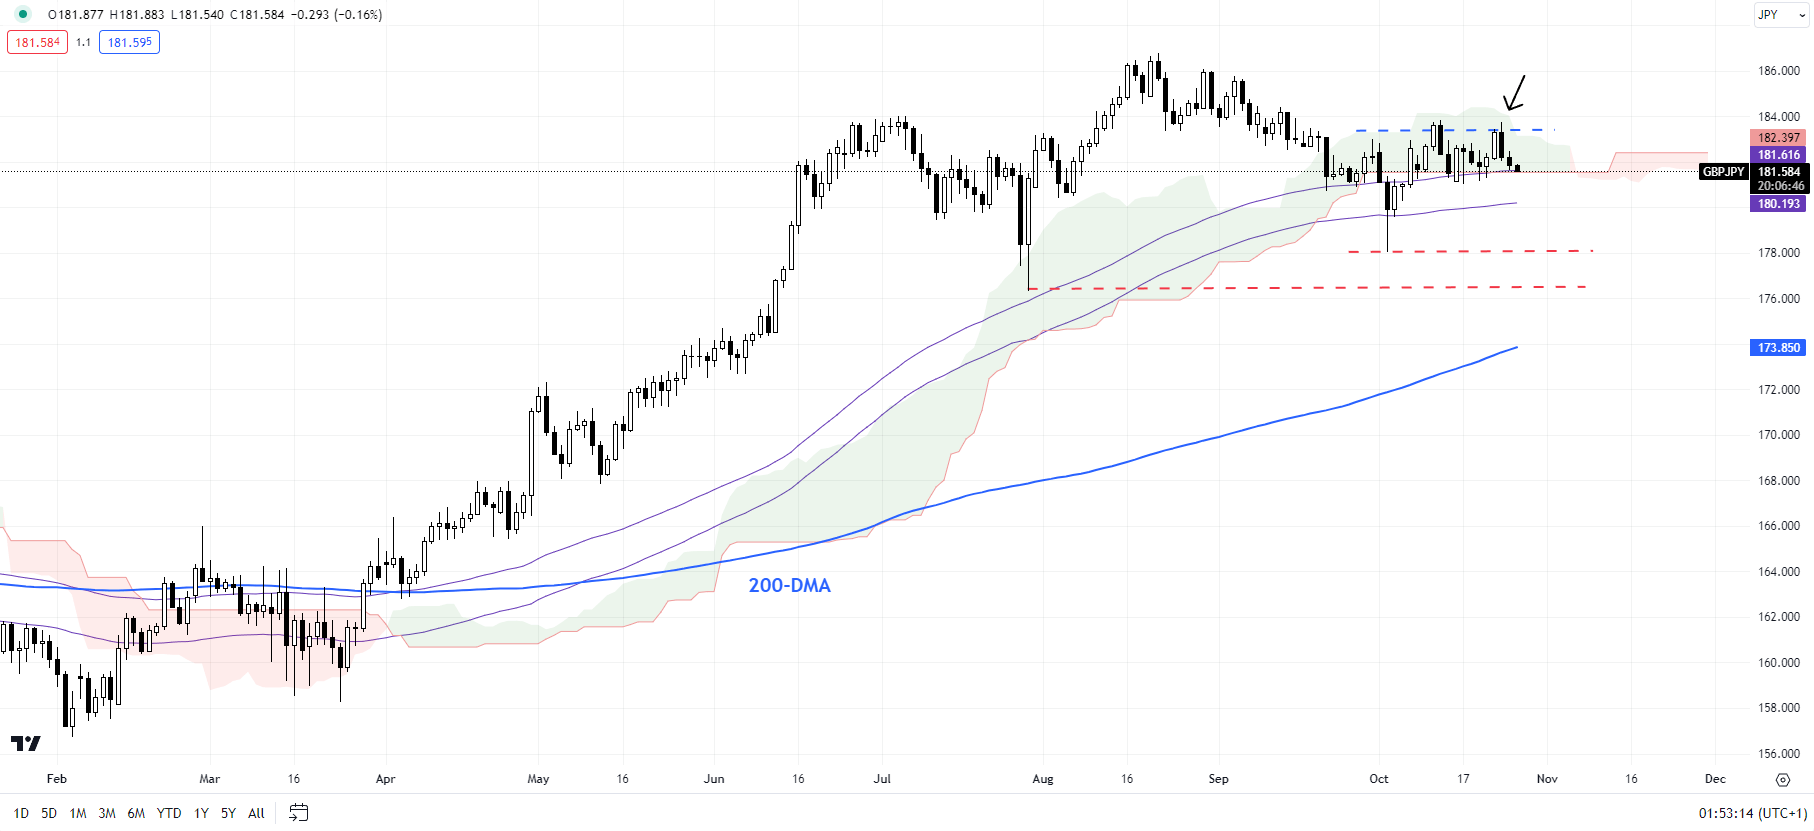
GBP/JPY Daily Chart
Chart Created by Manish Jaradi Using TradingView
GBP/JPY: Bullish move ahead?
GBP/JPY has gone sideways in recent days but continues to hold under a significant converged hurdle at the mid-October high of 183.75 and the upper edge of the Ichimoku cloud on the daily chart. As highlighted in the previous update. The recent correction lower since August is a sign of consolidation within the broader uptrend, and not necessarily a sign of reversal. The cross has major support at the July low of 176.25, which could limit extended weakness.
EUR/JPY Daily Chart
Chart Created by Manish Jaradi Using TradingView
EUR/JPY: At the top end of the range
EUR/JPY is back at the top end of the recent range of 154.00-160.00. Importantly, despite the consolidation, the cross continues to hold above a vital cushion on the 89-day moving average, coinciding with the lower edge of the Ichimoku cloud on the daily charts, near the early-October low of 154.50. This support area is strong and could be tough to crack, especially in the context of the broader uptrend following the break earlier this year above strong resistance at the 2014 high of 149.75.
Supercharge your trading prowess with an in-depth analysis of equities’ outlook, offering insights from both fundamental and technical viewpoints. Claim your free Q4 trading guide now!
Recommended by Manish Jaradi
Get Your Free Equities Forecast


