US DOLLAR OUTLOOK: TECHNICAL ANALYSIS – EUR/USD, USD/CAD & AUD/USD
- The U.S. dollar (DXY index) lacks directional bias as traders await new catalysts
- The U.S. inflation report will be the next important source of market volatility
- This article focuses on the technical outlook for EUR/USD, USD/CAD & AUD/USD
Most Read: US Dollar Technical Forecast: Setups on EUR/USD, USD/JPY, GBP/USD, USD/CAD
The U.S. dollar, as measured by the DXY index, was largely flat, trading around the 104.11 level on Wednesday. This lack of directional bias came against a backdrop of mixed U.S. Treasury yields as markets awaited new catalysts in the form of fresh data that could provide clues about the Fed’s monetary policy path.
US DOLLAR & YIELDS PERFORMANCE
Source: TradingView
There are no major U.S. economic releases scheduled for the next two days, but next week will bring the January inflation report. That said, annual headline CPI is expected to ease to 3.1% from 3.4% in December, while the core gauge is seen moderating to 3.8% from 3.9% previously.
If progress on disinflation advances more favorably than anticipated, the greenback will struggle to continue its recovery. Conversely, if price pressures prove stickier than forecast, the currency’s rebound could be turbocharged by a hawkish repricing of interest rate expectations.
Leaving fundamental analysis aside for now, this article will examine the technical outlook for three U.S. dollar FX pairs: EUR/USD, USD/CAD and AUD/USD, highlighting critical price levels that should be monitored in the coming sessions ahead of next week’s U.S. CPI figures.
Eager to discover what the future holds for the euro? Delve into our Q1 trading forecast for expert insights. Get your free copy now!
Recommended by Diego Colman
Get Your Free EUR Forecast
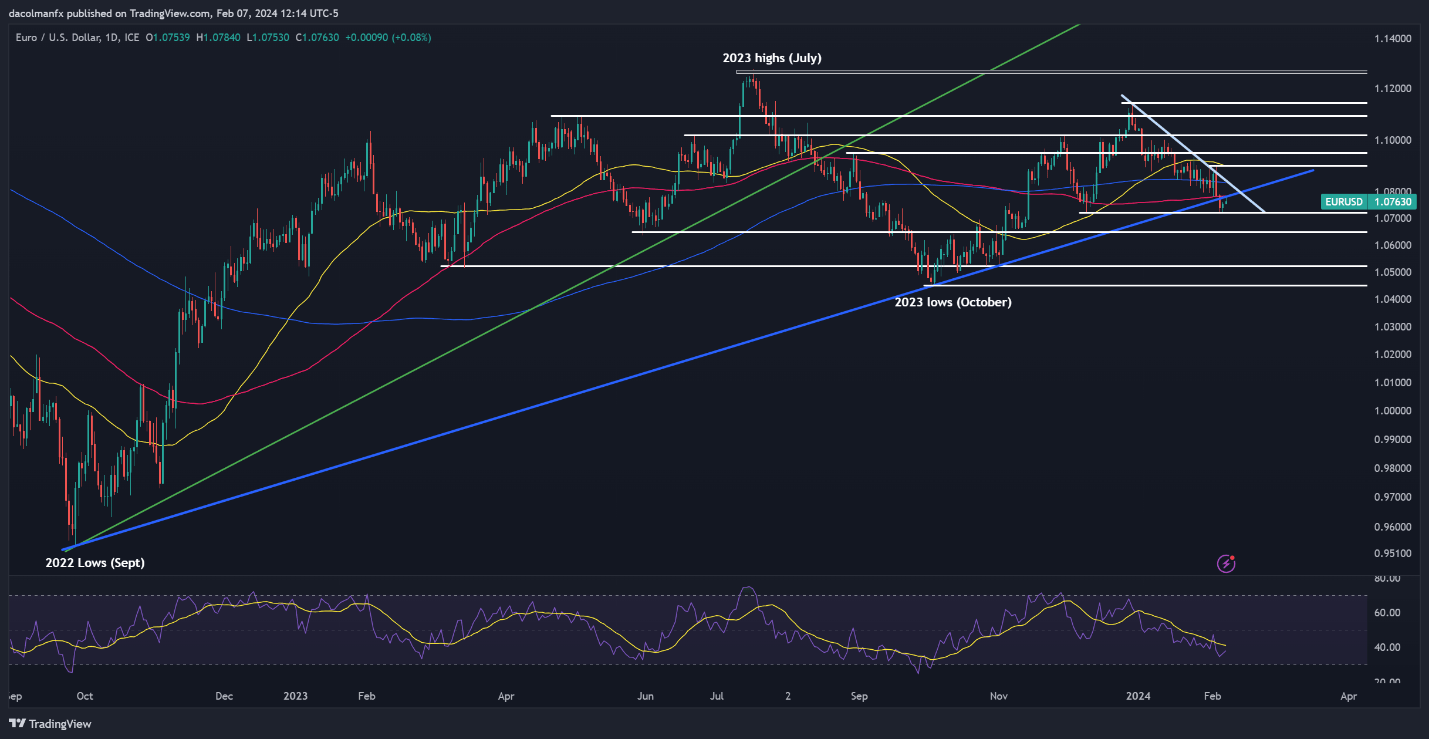
EUR/USD TECHNICAL ANALYSIS
EUR/USD inched higher on Wednesday, moving closer to cluster resistance at 1.0780. Should the bulls overcome this technical hurdle in the next few days, a rally toward the 200-day simple moving average and the trendline resistance around 1.0840 might be on the horizon.
Alternatively, if sellers stage a comeback and push the pair beneath support at 1.0720, we may see an escalation in bearish momentum, setting the stage for a drop toward 1.0650. The pair may stabilize around these levels during a pullback, but in case of a breakdown, a move toward 1.0524 could follow.
EUR/USD TECHNICAL ANALYSIS CHART
EUR/USD Chart Created Using TradingView
If you are discouraged by trading losses, why not take a proactive step to improve your strategy? Download our guide, “Traits of Successful Traders,” and access invaluable insights to assist you in avoiding common trading errors.
Recommended by Diego Colman
Traits of Successful Traders
USD/CAD TECHNICAL ANALYSIS
USD/CAD extended its retracement on Wednesday, threatening to break confluence support at 1.3535. If the pair closes below this floor decisively, sellers may launch an attack on the 50-day simple moving average near 1.3420. From this point, subsequent losses could bring attention squarely to 1.3380.
On the other hand, if bearish pressure abates and prices pivot higher, resistance appears at 1.3535, a key area where several swing highs from this and last month align with a key Fibonacci level. Climbing further, the focus will then transition to 1.3575 and 1.3620 in the event of sustained strength.
USD/CAD TECHNICAL ANALYSIS CHART
USD/CAD Chart Created Using TradingView
Delve into how crowd psychology influences FX trading patterns. Request our sentiment analysis guide to grasp the role of market positioning in predicting AUD/USD’s direction.
| Change in | Longs | Shorts | OI |
| Daily | 5% | 3% | 4% |
| Weekly | 6% | 11% | 8% |
AUD/USD TECHNICAL ANALYSIS
AUD/USD was subdued on Wednesday, with prices slightly lower after a failed attempt at clearing overhead resistance extending from 0.6525/0.6535. If the bearish rejection is confirmed with a negative close in the daily candle, we could soon see a pullback towards 0.6470 and possibly even 0.6395.
On the flip side, if the Australian dollar mounts a comeback, the first hurdle on the road to recovery emerges at 0.6525/0.6535. The bulls may encounter stiff resistance around this range, but a successful breach could potentially lead to a rally towards the 200-day simple moving average near 0.6575.

