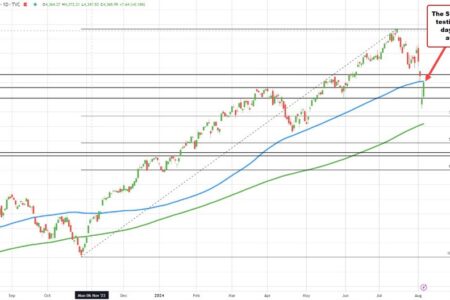

The S&P 500 is trading near its all-time high, up 115 points or 2.23% at 5301.95. The high so far is 5303.17. This puts the price 5.6 points away from its 100-day moving average. This moving average is at 5308.75. The price hit a low last Friday near this level and then rebounded to close.
However, the market saw a sharp decline on Monday following a drop in Japan’s Nikkei 225 index. The low price reached 5119.26. Since then, the price has risen by about 3.6%.
Beating the 100-day moving average is essential to the technical health of the market.
Staying below it will make traders look at this “correction” as a “correction” (if I can be redundant).
A move above this level would increase buyers’ confidence.
Meanwhile, the Nasdaq rose by about 400 points or 2.46% to 16,598.86. This lifted the price above the 16,442-16,358.86 swing zone target. This is more positive. The 100-day moving average at 16,881.63 is the next target.