introduction
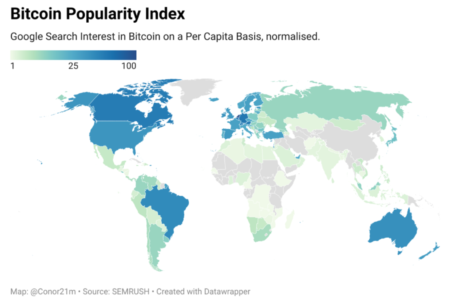
Introducing the Bitcoin Popularity Index (BPI), the first comprehensive research study of its kind. This index has been curated in an effort to measure Bitcoin’s global reach and influence through a large-scale analysis of Google search queries.
Unlike many studies that provide absolute data or mix different aspects of cryptocurrency, the BPI data aims to provide insights into Bitcoin interest specifically, by looking at factors such as linguistic diversity, Google browser dominance, and population sizes. This approach allows us to measure not only initial interest but also the relative intensity of Bitcoin participation across different countries. Therefore, we can highlight countries that punch above their weight relatively.
Although the interest rate index is not intended to be a definitive answer, it is a useful exercise – and perhaps the best shot we have amid imperfect data. By integrating these different elements, the Bitcoin Popularity Index offers a unique perspective, turning away from generic metrics to provide a richer, more contextual understanding of how Bitcoin adoption is progressing around the world.
You can download Chart here.
Key findings
- The USA recorded the highest number of inquiries with 14,432,650 inquiries per month, followed by Brazil with 12,400,260 inquiries. Germany, India and Turkey complete the top five.
- The top 7 and 8 of the top 10 are occupied by Western European countries (according to… EuroVoc regional definitions).
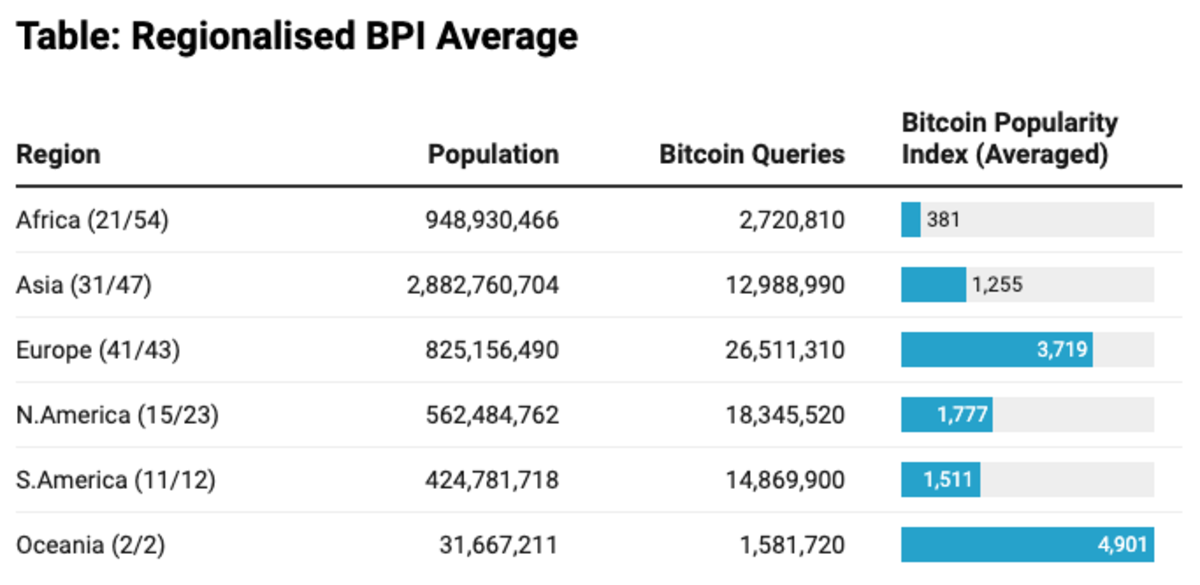
- “Western” countries around the world have an average BPI of around 3,720 (compared to 1,250 elsewhere), indicating the relatively high popularity of Bitcoin.
- Africa has the lowest BPI scores among the continents. This is not surprising given that the Internet penetration rate in Africa does not exceed 40%.
- The most prominent queries regarding Bitcoin are price queries, most often the price of Bitcoin against the dollar. However, in Egypt, Bitcoin is often priced in gold bullion rather than dollars or Egyptian pounds.
- The total number of monthly queries related to Bitcoin is approximately 77 million, with direct searches for “bitcoin” approaching 10 million.
- The ratio of queries for Bitcoin to Ethereum is 9:1.
Compare continents
Oceania has the highest average BPI at around 4,901, indicating Bitcoin’s very strong popularity in this region. These data are from only two countries (New Zealand and Australia), both of which benefit from high levels of Internet penetration.
Europe follows with an average BPI of 3,719 from 41 countries, demonstrating the relative strength of Bitcoin’s popularity across the continent, placing it well above most other regions.

Top 50 countries
Countries 1-15
Countries 16-32
Countries 33-50
Data collection methodology
- Data Selection: Since Google obscures all search query data for cryptocurrency-related terms, selecting the most reliable data set was important. In an effort to be as comprehensive as possible, all datasets from SEMRUSH, Ahrefs, DataOs, Moz, and Google Trends were downloaded and searched. SEMRUSH has proven to be the most reliable in terms of its accuracy and depth, which is consistent with Spark Toro study Besides SEMRUSH’s own research On search volume data.
- Data comparison and selection: Although results were mostly similar between SEMRUSH and Ahrefs, the two largest data sets available. There were significant differences between the two in many terms. Data for some countries showed a difference of more than 80%. This variability made it impractical to mix data or fill gaps in countries where SEMRUSH provided no data, because the differences were too large to reliably aggregate.
- Query Composition: Broad match queries for “Bitcoin” and “BTC” have been used across alphabet combinations including Latin, Arabic, Hebrew, Cyrillic, Japanese, Devanagari, Arabic-Persian, Cyrillic, Tamil, Sinhalese, Chinese, and Thai.
- Merging Demographic and Search Engine Data: Demographic figures were combined from World standardsGoogle market share data was obtained from Statistics counter. For the purposes of this study, Google’s market share was recalculated to 100% for all countries to standardize the effect of search engine use on the data.
- Calculating search volume per capita: Using the above data, search query volume per capita was calculated for each country. This step was crucial to normalizing the data across different demographic groups, allowing for a similar comparison of Bitcoin’s utility regardless of country size.
- Data Visualization: The final results were classified and plotted on a Chloropleth Map using a visualization tool Data wrapper. This provided a clear visual representation of Bitcoin’s popularity in different countries, highlighting regions with particularly high or low levels of participation.
The percentage of the country’s population using the Internet was not taken into account in the calculations, since those without Internet access are less likely to show interest in Bitcoin. The recently published Internet adoption rate in Africa is 40%, which is comparable to rates in Europe and the USA in 2005. Although this rate remains low, it is increasing, as is the case with Bitcoin adoption.
Data scope and limitations
The Bitcoin Popularity Index (BPI) provides comprehensive insights; However, it is limited by the absence of data from 77 countries, including China, Iran, Cuba and 33 African countries – especially Tanzania, Kenya and Sudan. This lack of data from major regions can lead to an incomplete global perspective on Bitcoin sharing.
Furthermore, the BPI is based on third-party estimates, as Google does not share specific search query data for Bitcoin or other cryptocurrencies. VPNs can also play their part by obscuring where searches originate from, but this is not expected to affect results much.
The data is wrong in a few countries, as “BTC” is the name of a phone company in the Bahamas, an internet provider in Botswana, and a shopping mall in Slovenia.
summary
The Bitcoin Popularity Index (BPI) provides a detailed look at global interest in Bitcoin through the lens of Google search queries. While this study uses the best data available, it is important to note that it is not intended to definitively answer which country has the strongest Bitcoin adoption. Instead, the BPI serves as a measure of public interest and interaction with Bitcoin across different countries.
The data reveals that Oceania has the strongest CPI scores, although Europe shows the greatest strength across the board, with 41 out of 43 countries performing strongly. It is also clear that search data is stronger in countries with higher Internet penetration, biasing the data in favor of these countries.
A valuable follow-up to this study would include examining other metrics that could provide further insights into Bitcoin adoption. Some examples of these metrics include the number of Bitcoin nodes, Bitcoin Lightning Network nodes, or hash rate distribution. These data points can provide a more comprehensive understanding of how deep Bitcoin’s penetration is in different regions and can help paint a fuller picture of its global adoption.
Furthermore, the goal is to make the BPI an annual calculation, providing a rough, comparative estimate of how interest in and adoption of Bitcoin has progressed across all countries surveyed on an annual basis.
