US DOLLAR FORECAST
- The U.S. dollar, as measured by the DXY index, sinks to its lowest level in five months, with thin liquidity conditions likely amplifying the selloff
- Growing expectations that the Fed will substantially ease its stance in 2024 have been the main driver of the greenback’s retreat in recent weeks
- This article offers an analysis of the U.S. dollar’s technical and fundamental outlook, examining essential price thresholds that could act as support or resistance in the coming trading sessions
Trade Smarter – Sign up for the DailyFX Newsletter
Receive timely and compelling market commentary from the DailyFX team
Subscribe to Newsletter
Most Read: US Dollar in Risky Waters, Technical Setups on EUR/USD, GBP/USD, Gold
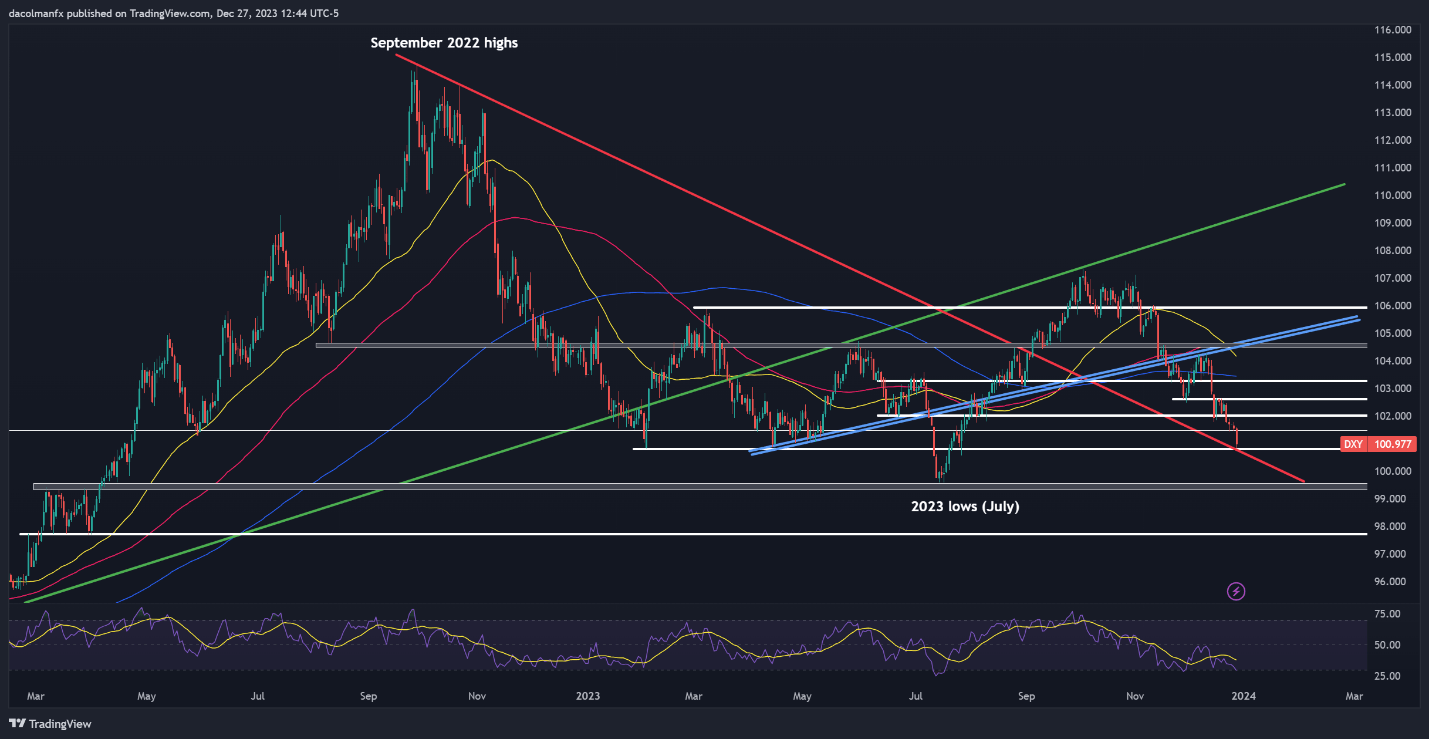
The U.S. dollar, as measured by the DXY index, plunged to its weakest point in five months on Wednesday (DXY: -0.55% to 100.98), pressured by a substantial drop in Treasury rates, with the 2-year yield sinking below 4.26%, its lowest level since late May.
While market moves were likely amplified by thin liquidity conditions, characteristic of this time of year, wagers that the Federal Reserve will cut rates materially in 2024 have been the primary bearish driver for the greenback in recent weeks.
The Fed’s pivot at its December FOMC meeting has reinforced ongoing market trends. For context, the central bank embraced a dovish stance at its last gathering, indicating that talks about reducing borrowing costs have begun, possibly as part of a strategy to prioritize growth over inflation.
The chart below shows how the DXY index has been falling for a while, just as easing expectations for the upcoming year have trended higher in a meaningful way.
For a comprehensive analysis of the U.S. dollar’s prospects, get a copy of our free quarterly outlook now!
Recommended by Diego Colman
Get Your Free USD Forecast
Source: TradingView
From a technical standpoint, the U.S. dollar broke below 101.50 and sank toward support at 100.75 on Wednesday. Bulls must defend this area at all costs to curb downward pressure; failure to do so could result in a pullback toward the 2023 lows near 99.60. On further weakness, the focus shifts to 94.75.
Conversely, if buyers return in force and spark a bullish bounce off current levels, overhead resistance looms at 101.50, followed by 102.00. Considering the prevailing sentiment, breaching this hurdle will be a formidable task for the bulls. However, if surpassed, attention will turn to 102.60 and 103.30 thereafter.
If you are discouraged by trading losses, why not take a proactively positive step towards improvement? Download our guide, “Traits of Successful Traders,” and access invaluable insights to assist you in avoiding common trading errors.
Recommended by Diego Colman
Traits of Successful Traders

