
Did you miss the opportunity to rise in the daily trend line of the EUR/GBP pair?
I see a continued pullback to this potential support area, which coincides with the Fibonacci retracement levels.
Is the Euro heading higher soon?
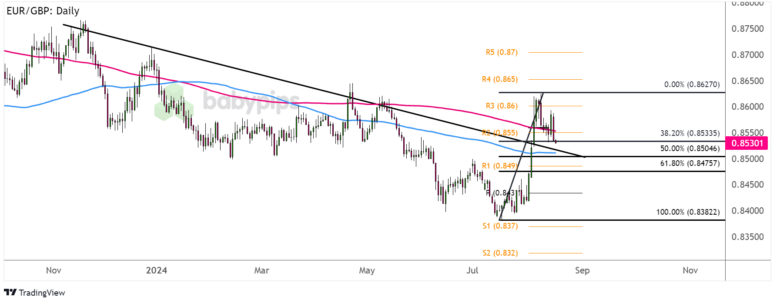
EUR/GBP Daily Currency Pair Chart by TradingView
As you can see on the daily time frame of the pair above, the price has formed lower highs connected by a downtrend line that has been holding since November of last year.
However, the EUR/GBP pair surged sharply when markets seemed to panic early last week. The shared currency appeared to be enjoying a piece of the safe-haven pie at the time while also riding the upward momentum following positive CPI readings released earlier.
The pair has since retreated from its highs at 0.8627 and is now retreating to the 38.2% Fibonacci retracement level.
Is it possible to resume the uptrend from here?
Remember that directional biases and volatility in market prices are usually driven by fundamentals. If you haven’t done your homework on the Euro and the British Pound, it’s time to take a look at the economic calendar and stay up to date with the daily fundamental news!
The 100 SMA is still below the 200 SMA indicating a bearish sentiment, but the pair has broken above both indicators which may now hold as dynamic support areas.
A bigger pullback could test the 50% Fibonacci retracement level closest to the broken trendline around the key psychological support level of 0.8500 or the 61.8% level near the first resistance level (0.8490). If either of the Fibonacci retracement levels is enough to control losses, watch for a continued rise to the higher level near the third resistance level (0.8600).
Just be sure to look out for any major swings in market sentiment from the next set of catalysts!
Comments are closed, but trackbacks and pingbacks are open.