
This forex pair has recently broken out of a daily triangle consolidation pattern, indicating the beginning of a long-term trend.
Is the rally fading or is it just a retest?
Take a look at these turning points on the long-term chart!
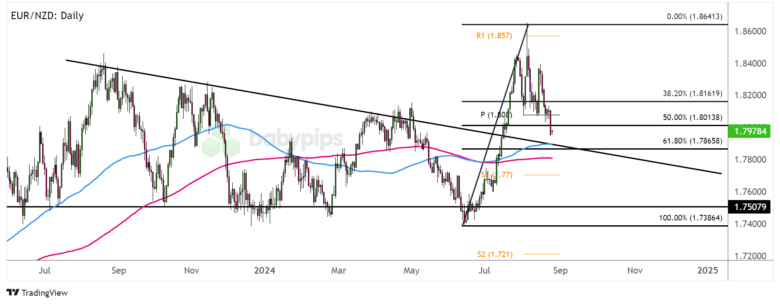
EUR/NZD Daily Currency Pair Chart by TradingView
After consolidating within a descending triangle pattern for almost a year already, the EUR/NZD pair broke through the resistance level last month, suggesting that a long-term uptrend may be about to take place.
However, the pair faced another major hurdle around the 1.8640 level, forcing the EUR bulls to pull back from their attack.
Is this just a pullback from the ongoing uptrend or are we witnessing the beginning of a reversal?
Remember that directional biases and volatility in market prices are usually driven by fundamentals. If you haven’t done your homework on the EUR and NZD yet, it’s time to take a look at the economic calendar and stay up to date with the daily fundamental news!
The 100 SMA is above the 200 SMA, suggesting that buyers have the upper hand and that support levels are likely to hold rather than break. The price is already testing the 50% Fibonacci retracement level near the key psychological level of 1.8000 but could be poised for a larger correction to the 61.8% Fibonacci retracement level closer to the previous triangle top.
If any of these levels manage to keep losses under control, the pair could refocus on the August highs near R1 (1.8570) and beyond.
On the other hand, a return inside the triangle could push EUR/NZD to the next support area at S1 (1.7700) or even back to the triangle support at the key psychological level of 1.7500.
Whichever way you decide to play this setup, make sure to practice proper risk management and keep an eye out for major market catalysts to come!
Comments are closed, but trackbacks and pingbacks are open.