
With all the top-tier U.S. catalysts lined up, we might just see big moves from the dollar index soon!
Here’s a trend setup I’m watching on the daily time frame.
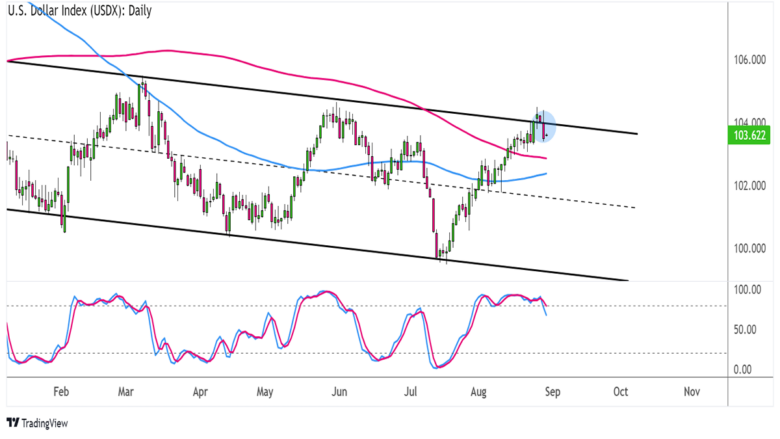
As you can see from the long-term chart below, USDX has been cruising with lower highs and lower lows inside a descending trend channel.
U.S. Dollar Index (USDX): Daily
U.S. Dollar Index (USDX) Daily Chart by TV
The U.S. dollar index is now testing the very top of this channel, and technical signals are hinting at another major leg lower.
For one, the 100 SMA is below the 200 SMA to confirm that bearish vibes are in play. Also, Stochastic finally looks ready to head south after spending some time in the overbought zone to reflect exhaustion among dollar bulls.
To top it off, I’m seeing a bearish Japanese candlestick pattern right on the channel resistance at 104.00!
If the ceiling holds, watch out for a sustained selloff to the next support levels such as the channel bottom or even the mid-channel area of interest around 101.00.
We’ve got the U.S. preliminary GDP reading, core PCE price index, and August NFP report to keep tabs on in order to gauge if more dollar losses are in the cards.
In particular, a downgrade to the Q2 GDP figure or a weaker than expected inflation print might be enough to get dollar bears going.
Just make sure you practice proper risk management when trading this one!