
We’ve got a simple technical setup heading to the watchlist, this time a longer-term setup developing on oil! Will the market reach a MAJOR area of support and will buyers defend it?
WTI Crude Oil (CFD): Daily
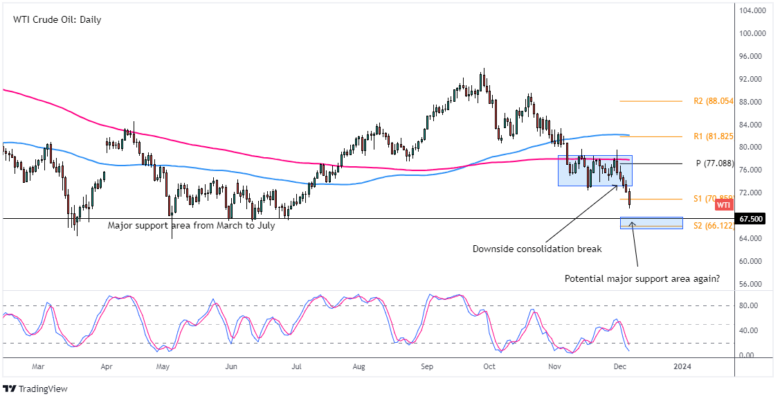
WTI Crude Oil Daily Chart by TradingView
As always, remember that directional biases and volatility conditions for market price are typically driven by fundamentals. And if you haven’t done your fundie homework on the oil yet, then it’s time to do some work by checking out the forex calendar and daily fundamental news for oil price drivers like inventory updates, OPEC news, and economic growth data!
If you have done your fundies homework, then it’s time to move to the charts!
Today, it’s going to be a very simple setup that every trader should have on the watchlist. On the Daily chart above, we can see oil bears have been pushing the price lower since the end of September from roughly around $95.00 a barrel. But recently, the market was stuck in a holding pattern between $73.00 – $77.00, which recently broke and is picking up momentum to the downside.
Oil is now almost nearly back to a major area of support, the $67.50 handle which consistently brought in buyers multiple times between March 2023 until July 2023, before the start of a big move higher.
So from a pure price action standpoint, this area is likely to draw in buyers if retested, not only technical players playing the support pattern, but also those who may be looking to take profits off of a short position.
Of course, whether or not buying support translates into a big move higher will be up to the fundamentals. Don’t automatically think a rally will play out from this area–don’t your fundies homework first!
Now for you fundamental oil bears out there, the short-term opportunity may be to go for the $67.50 at market, but the potential return-on-risk isn’t very attractive at current levels, of course depending on the risk management plan. The longer-term opportunity may be to wait for a bounce from the $67.50 area and then see if bearish reversal patterns form before working on a short leaning risk management plan.
If a retest and bounce does play out, and based on the average daily true range of around $2.65, a bounce may get to the $70 – $73 area before sellers step back in.
Finally, a sustained downside break of the major support area is likely the behavior that would really draw in technical sellers, and if so, the $62.00 – $65.00 area would be the initial area that may draw in short-term support, again based on the daily average true range.
But what do you think? We love to hear everyone’s ideas so feel free to drop a comment below and share your thoughts!