
This forex pair is stuck in consolidation and currently testing its triangle bottom.
Will we see another bounce soon?
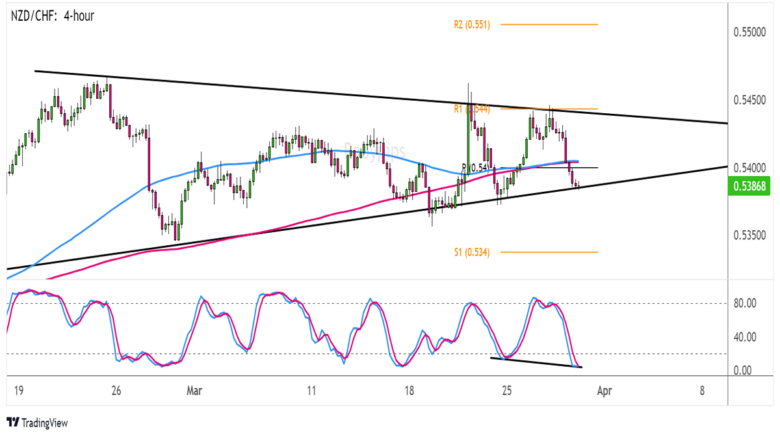
Check out these levels and indicators I’m watching on the 4-hour time frame.
NZD/CHF 4-hour Forex Chart by TradingView
Both the Kiwi and Swiss franc have been on weaker footing lately, as the New Zealand economy is facing a grim outlook for growth while the Swiss National Bank (SNB) recently announced a surprise rate cut.
Because of that, NZD/CHF has been moving sideways, forming higher lows and lower highs to consolidate inside a symmetrical triangle pattern.
Can it break out soon? And which way might it go?
Remember that directional biases and volatility conditions in market price are typically driven by fundamentals. If you haven’t yet done your fundie homework on the Kiwi and Swiss franc, then it’s time to check out the economic calendar and stay updated on daily fundamental news!
Stochastic is already dipping into the oversold region to signal exhaustion among sellers, so turning higher might mean that buyers are ready to get back in action and spur a bounce back to the triangle top.
In addition, the oscillator is forming lower lows while the pair had higher lows, creating a potential bullish divergence!
If support holds, watch out for a move back up to the resistance near R1 (.5440) and the .5450 minor psychological mark. A break below the triangle bottom, on the other hand, could trigger a selloff that’s the same height as the chart pattern.
NZD/CHF is trading below both moving averages, too, so these might keep holding as dynamic resistance levels. If sellers stay in control, look out for a drop to the next downside target at S1 (.5340) or lower.
Good luck and good trading this one!