
Is that a sketchy head and shoulders pattern I’m seeing on the 4-hour chart of this U.S. stock index?
And if price is already breaking down the neckline of the reversal formation, just how low can it go from here?
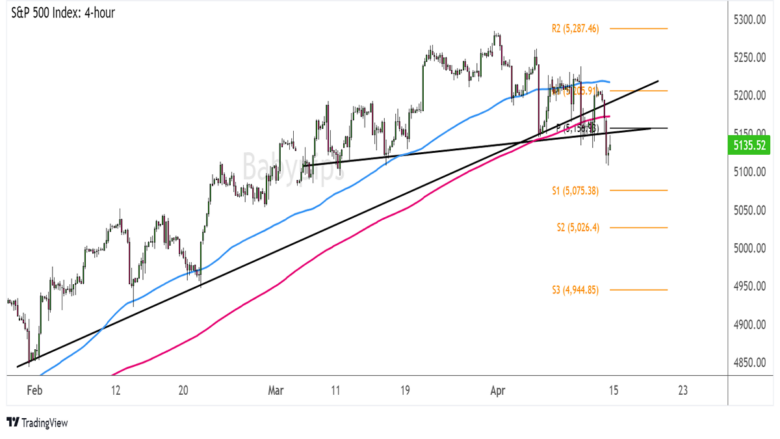
Check out the nearby inflection points I’m watching!
S&P 500 Index (SPX500) 4-hour Chart by TradingView
Strong risk-off flows on geopolitical headlines over the weekend are expected to bring fresh bearish vibes for the U.S. equity market.
In an unprecedented attack, Iran launched a series of more than 300 missile and drone attacks on Israel, bringing tensions to new heights and even sparking fears of another world war.
Remember that directional biases and volatility conditions in market price are typically driven by fundamentals. If you haven’t yet done your fundie homework on market sentiment and U.S. equities, then it’s time to check out the economic calendar and stay updated on daily fundamental news!
A counterattack might happen anytime, keeping global investors on edge. Now the S&P 500 index already fell through its ascending trend line to signal that a reversal is in the works and is now testing the neckline of its head and shoulders pattern.
Another breakdown could set off a drop that’s the same height as the formation, possibly sending the equity index down to S2 ($5,026.40) then S3 ($4,944.85).
The 100 SMA is still above the 200 SMA to suggest that bullish momentum is in play, but the index has fallen below both moving averages as an early signal of a trend shift.
In any case, don’t forget to keep tabs on geopolitical news, as well as U.S. earnings reports, as these could continue to impact stock market movements. Don’t forget to review this week’s set of top-tier economic catalysts, too!