
Trend traders huddle up!
The U.S. dollar took a lot of hits in the last couple of days, enough to drag the U.S. dollar index (DXY) waaay lower in the 4-hour charts.
How low can the index go?
U.S. Dollar Index (USDX): Daily
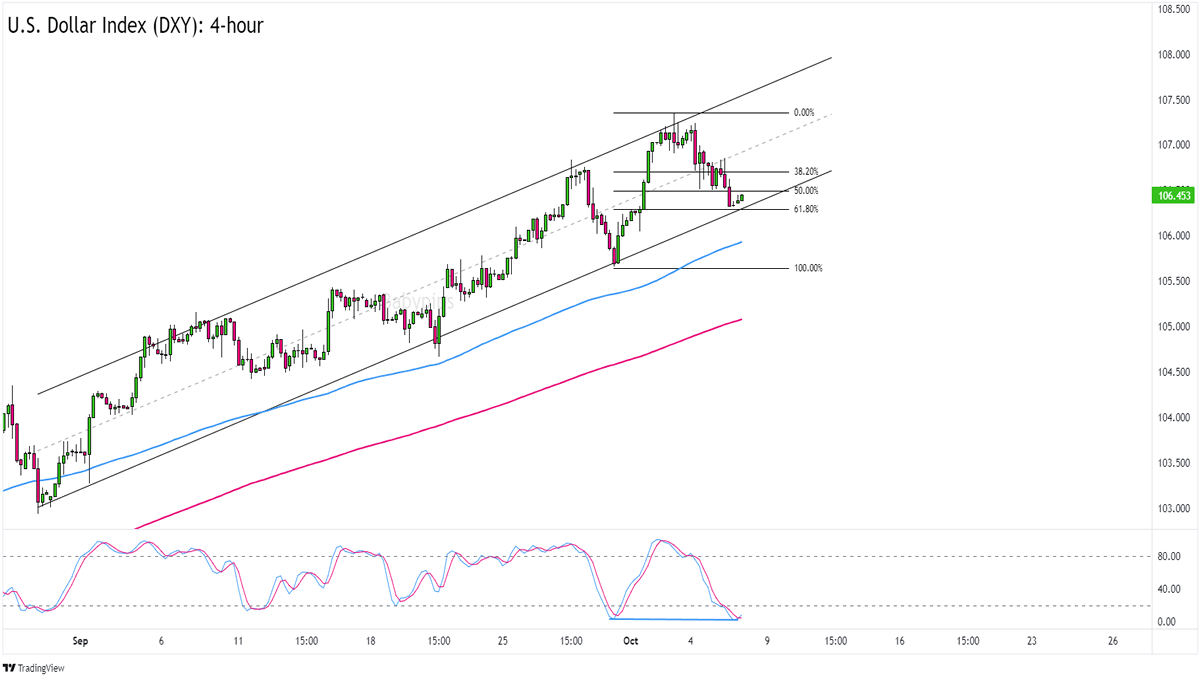
U.S. Dollar Index (USDX) 4-hour Forex Chart by TV
The U.S. Dollar Index has been in an uptrend since mid-July when it started poppin’ higher highs and higher lows.
This week’s drama involves the index turning lower from the 107.25 minor psychological level.
DXY is currently trading near 106.50, which is close to the 61.8% Fibonacci retracement of an upswing from late September.
In addition to that, DXY’s current levels also line up with an ascending channel support that hasn’t been broken since the start of September.
Think DXY will return to its uptrend soon?
Not only are both the 100 and 200 SMA still pointing higher, but the 100 SMA is also implying a sustained bullish momentum as it maintains its gap against the slower 200 SMA.
Meanwhile, DXY’s price chart is showing a bullish divergence against Stochastic on the 4-hour time frame.
A couple of strong bullish candlesticks could start another upswing for DXY. The 107.25 previous high may serve as an initial target but you can also eye new monthly highs especially if USD’s upswing is backed by a fundamental catalyst.
Not convinced that DXY can see further gains?
You can also wait for a clear channel breakout or sustained trading below the 100 SMA or 106.00 level if you’d rather short the dollar. Just make sure that you’re not trading a fakeout!