
The EURJPY is trading in and up and down range over the last 5 – 6 weeks with most of the activity between 156.86 and 159.48. There have been a few wonders above and below that area, but those breaks were brief and did not gather much momentum.
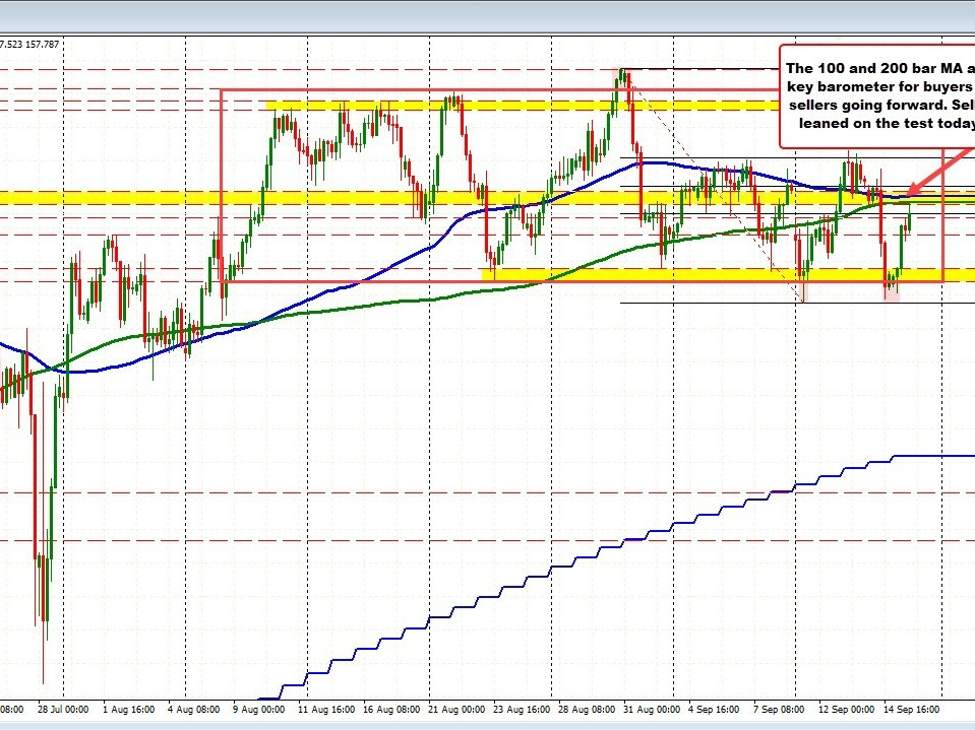
In trading today, the price has rebounded higher and in doing so, the price has extended up toward its 200 or moving out on the 4 hour chart at 157.948. Just above that is the 100 bar moving average at 158.02.
EURJPY on the hourly chart
Sellers have leaned against those moving average level on the 1st test keeping the sellers/bears and play. If the price were to move above, the bias would shift more in favor of the buyers.
Looking at the daily chart below, the corrective lows seen this week in the EURJPY pair tested the 38.2% retracement of the move up from the end of July load to the high price seen in August. That retracement level comes in at 156.56. The low price this week came in at 156.57.
If the sellers are to take more control, they would need to extend below that level.
EURJPY tested the 38.2% retracement of last move higher