GBP/USD, GBP/AUD PRICE, CHARTS AND ANALYSIS:
Read More: WTI, Brent Shrug Off US Inventories Surge as Oil Prices Hit Fresh 2023 Highs
GBP has faced selling pressure this week weighed down in part by GDP data, with an increase in total earnings unable to arrest the slide. Now obviously there was some mitigating effects on the recently released data which may blur the actual picture but comments from policymakers including Chancellor Hunt hint at a tough time ahead for the UK as energy prices soar once more.
Recommended by Zain Vawda
Forex for Beginners
UK RECESSIONARY FEARS AND BANK OF ENGLAND EXPECTATIONS
The fear in the UK who still have the highest inflation rate in comparison to the Euro Area and the US. This coupled with rising unemployment and a perceived slowdown in GDP growth have market participants on the edge of their seats, as it seems likely further rate hikes may be needed to see inflation cool further. Such a move is seen by many as likely to tip the UK into a technical recession, while a pause may see inflation rise once more which then would pose a new set of challenges. This is the current balancing act facing the Bank of England and with the ECB rate hike yesterday likely to add further pressure on the Central Bank.
Inflation comparisons between the Euro Area, US and the UK
Source: TradingView, Chart Created by Zain Vawda
EXTERNAL PRESSURE FACING GBP/USD AND GBP/AUD
The Dollar index for its part is enjoying a bullish rally of note, on course for a 9th successive week of gains ahead of the FOMC Meeting. The data this week from the US particularly retails sales and inflation keeping the US dollar moving forward. Market participants for now though are pricing in a greater probability of a pause next week which in my opinion will not have a huge impact on the current strength of the DXY particularly as Europe and the UK inch closer to potential recessions. I do think the Fed will pause next week as I have mentioned of late there are signs that the US economy may finally slowdown in Q4 as we have the end of the student loan repayment pause as well as a deterioration in household savings. I see this as a potential threat to the strong demand and negatively impact retail sales data moving forward and may prompt the Fed to ‘wait and see’ in order to gauge the potential impact.
GBPAUD has been on a tear this year but has come in for a slight pullback of late. Positive Australian data earlier this week coupled with support measures in China and an uptick in retail sales and industrial production has given the Aussie Dollar a boost. There is some mid-tier data from Australia next week which could further bolster the Australian Dollar and could see the retracement in GBPAUD extend further. We will break down potential key levels in the Technicals below.
It will be interesting to gauge the impact of the rate cut from China on sentiment as the US session arrives. The DXY largely benefitted from the uncertainty and poor risk sentiment last week, will that continue ahead of the Jackson Hole Symposium?
RISK EVENTS AHEAD
There is a lot in terms of risk events next week that could stoke volatility. However, because we have data from the various countries, we could see a lack of follow through on any moves which occur immediately after the data releases.
An example would be the FOMC meeting on Wednesday which will be closely followed by the BoE on Thursday. I will be keeping a close eye on whether any gains or losses for GBPUSD following the FOMC will be sustainable, something which has proven a challenge for markets of late.
For all market-moving economic releases and events, see the DailyFX Calendar
For a Full Breakdown on Trading Breakouts, Get Your Free Guide Below
Recommended by Zain Vawda
The Fundamentals of Breakout Trading
TECHNICAL OUTLOOK AND FINAL THOUGHTS
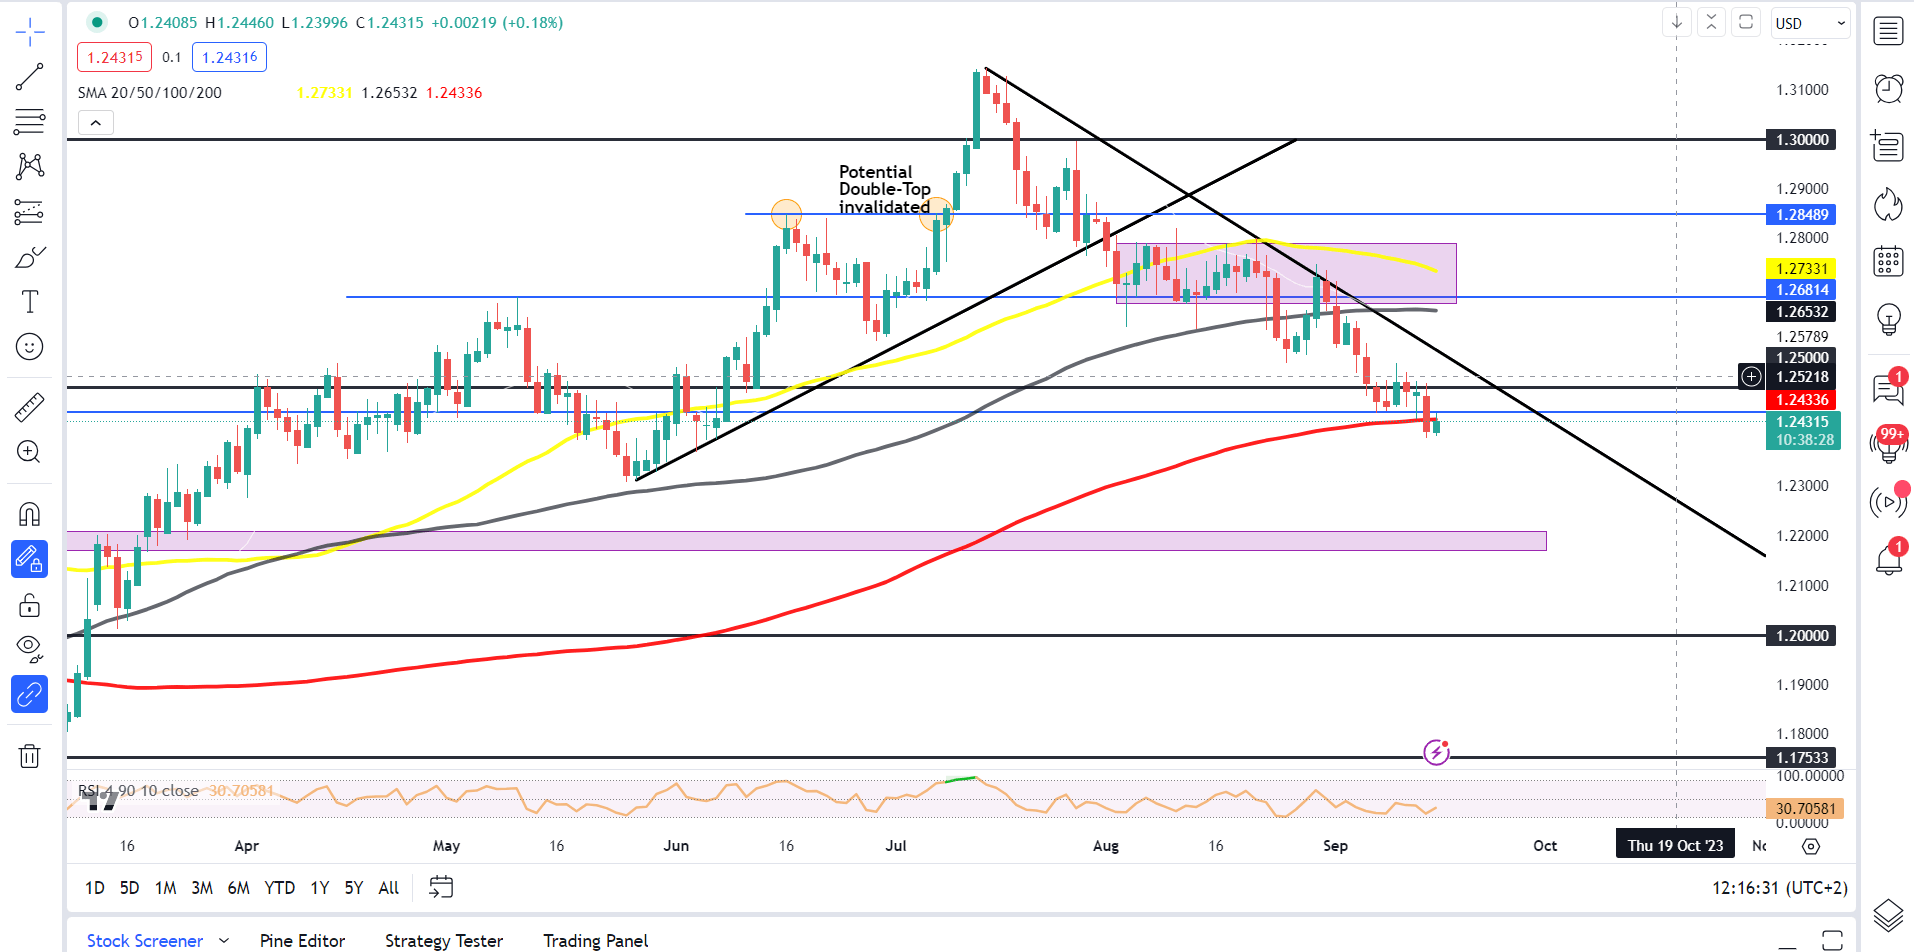
GBPUSD has been ticking lower since the fresh YTD high on July 13, and continued that decline this week with a daily candle close below the 200-day MA. This is the first time GBPUSD trades below the 200-day MA since March 2023. I would personally like to believe that this is a big deal, yest recent moves in other assets have shown that we could very easily change course on the flip off a coin.
We are already seeing a pullback this morning with a retest of the 200-day MA as the Dollar Index (DXY) has had a slow European session. We do have Michigan Consumer Sentiment data later which could push for a revisit of yesterday’s lows at the 1.2400 mark.
Cable does have the potential to retest the current descending trendline in play before a potential downside continuation. The question is whether the Pound will have the legs as well as whether the USD can maintain its momentum in the early part of next week.
Key Levels to Keep an Eye On:
Support levels:
Resistance levels:
- 1.2500
- 1.2653 (100-day MA)
- 1.2733 (50-day MA)
GBP/USD Daily Chart
Source: TradingView, Created by Zain Vawda
IG Retail Trader Sentiment shows that 67% of traders are currently NET LONG on GBPUSD.
For a more in-depth look at GBP/USD sentiment and the changes in long and short positioning, download the free guide below.
| Change in | Longs | Shorts | OI |
| Daily | -3% | -5% | -3% |
| Weekly | 11% | -11% | 3% |
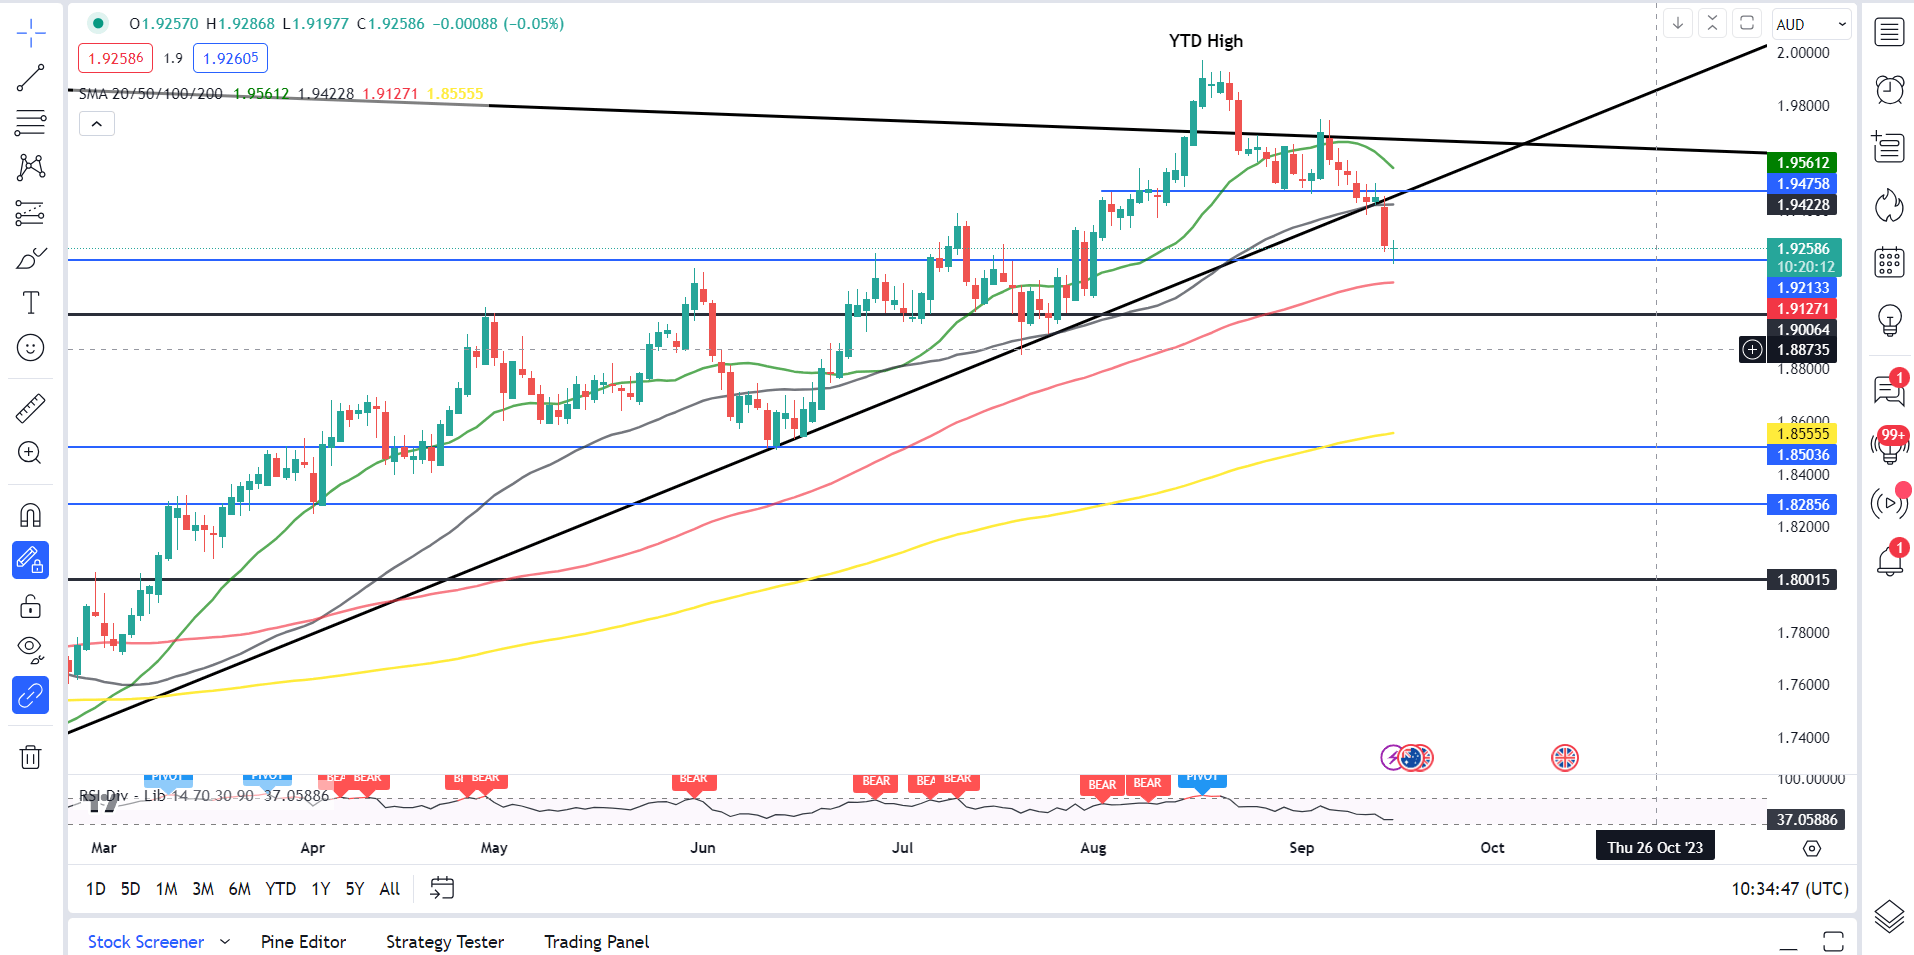
GBPAUD stalled just short of the psychological 2.0000 mark before putting in a significant pullback to support at the 1.9210 mark. The pair is looking like it is setting up a potential bounce from here as the overall uptrend still remains intact.
GBPAUD has however broken below the long-term ascending trendline which could hint at a bounce from here before continuing to fall. I think the driving factor here will be the outlook moving forward from both the UK and Australian economies moving forward.
The MAs as well appear to be setting up for a death cross heading into next week, a further sign of the growing potential of a deeper retracement given the size of the initial move to the upside. If we do see a continued push to the downside immediate support is provided by the 100-day MA around the 1.9120 mark and could prove to be key next week.
GBPAUD Daily Chart
Source: TradingView, Created by Zain Vawda
— Written by Zain Vawda for DailyFX.com
Contact and follow Zain on Twitter: @zvawda


