Gain a competitive edge in 2024: Access DailyFX’s Q1 guide to unlock potential trading opportunities and market insights.
Recommended by Warren Venketas
Get Your Free Top Trading Opportunities Forecast
British Pound Fundamental Backdrop
The British pound enters 2024 on a relatively strong footing against the USD after markets reacted ‘dovishly’ to the Federal Reserve’s more accommodative messaging in the last FOMC announcement. That being said, the most recent data from the UK showed a stark shift in the inflation trend whereby both headline and core inflation metrics fell sharply. Up until then, the UK was touted an outlying economy with sticker inflation than its developed market counterparts.
The Bank of England (BoE) now has a more complex task of timing interest rate cuts so as to not shock the economy or possibly reignite inflationary pressures. Currently, markets expect the first rate cut to begin in May 2024 (refer to table below) with approximately 134bps of cumulative rate cuts by year-end. An extension of lower inflation could bring forward this first round of cuts as soon as February.
For a complete overview of the British pound’s technical and fundamental outlook in the coming months, make sure to download your complimentary Q1 trading forecast now!
Recommended by Warren Venketas
Get Your Free GBP Forecast
Bank of England Interest Rate Probabilities
Source: Refinitiv, Prepared by Warren Venketas
From a US dollar perspective, the almost automated reaction by markets to a dovish Fed Chair Jerome Powell could be too much too soon. Considering external risk drivers including the wars in Ukraine and Gaza, any slight escalation could bring the safe haven appeal of the greenback into play. Implied Fed funds futures suggest 150bps of rate cuts by December 2024 and this projection has seen some pushback from certain Fed officials. The risk to current pricing is skewed towards a lesser easing cycle which could ultimately see GBP/USD fall.
Curious to learn how retail positioning can shape the short-term trajectory of GBP/USD? Our sentiment guide has all the relevant information you need. Grab a free copy now!
| Change in | Longs | Shorts | OI |
| Daily | -1% | -2% | -1% |
| Weekly | -1% | -3% | -2% |
GBP/USD Technical Analysis
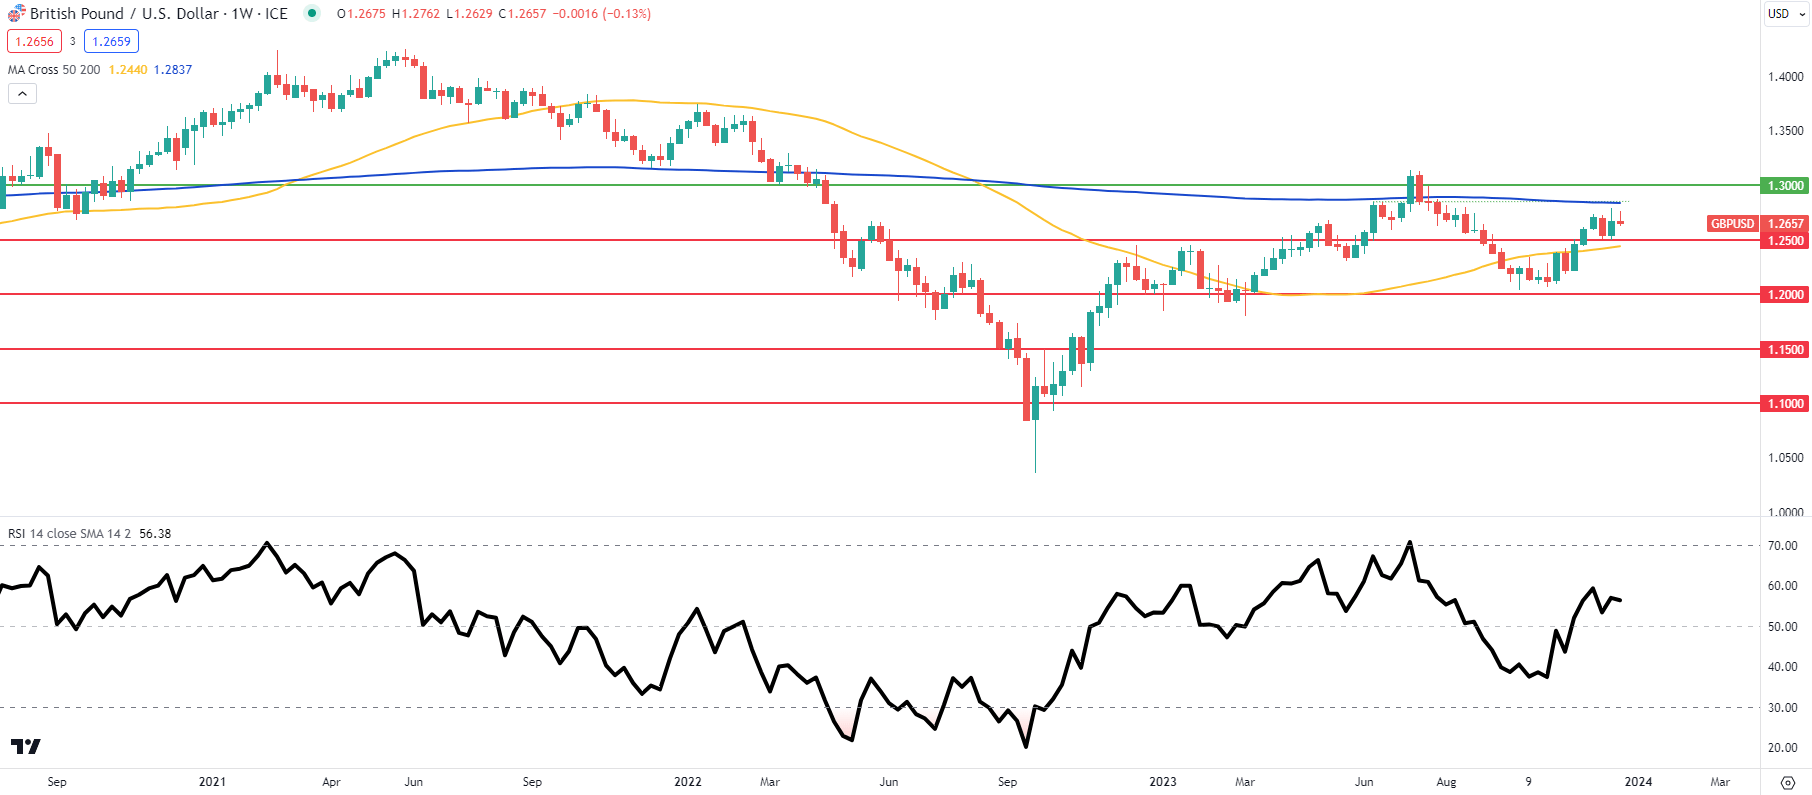
Weekly GBP/USD price action below can be seen tentatively testing the 200-week moving average (blue) after failing a breakout in mid-July 2023. I believe we will see a breach above this level in due course but may not be as early as Q1. That being said, incoming data is of utmost importance and a confirmation close above, could spark a continuation of the recent upside rally.
GBP/USD Weekly Chart
Source: TradingView, Prepared by Warren Venketas
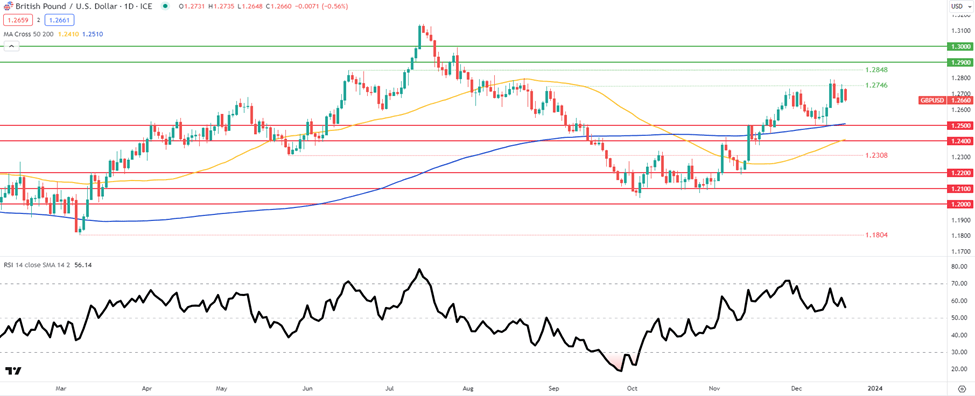
Cable’s consolidation around the 1.2746 swing high shows bearish/negative divergence as the Relative Strength Index (RSI) ticks lower coming out of the overbought territory. While I do not expect major moves in Q1, markets should pull back somewhat in early Q1 before settling around current levels towards the latter part of the quarter.
GBP/USD Daily Chart
Source: TradingView, Prepared by Warren Venketas
Key resistance levels:
Key support levels:
- 1.2500/200-day MA (blue)
- 1.2400/50-day MA (yellow)


