USD/CAD PRICE, CHARTS AND ANALYSIS:
Read More: The Bank of Canada: A Trader’s Guide
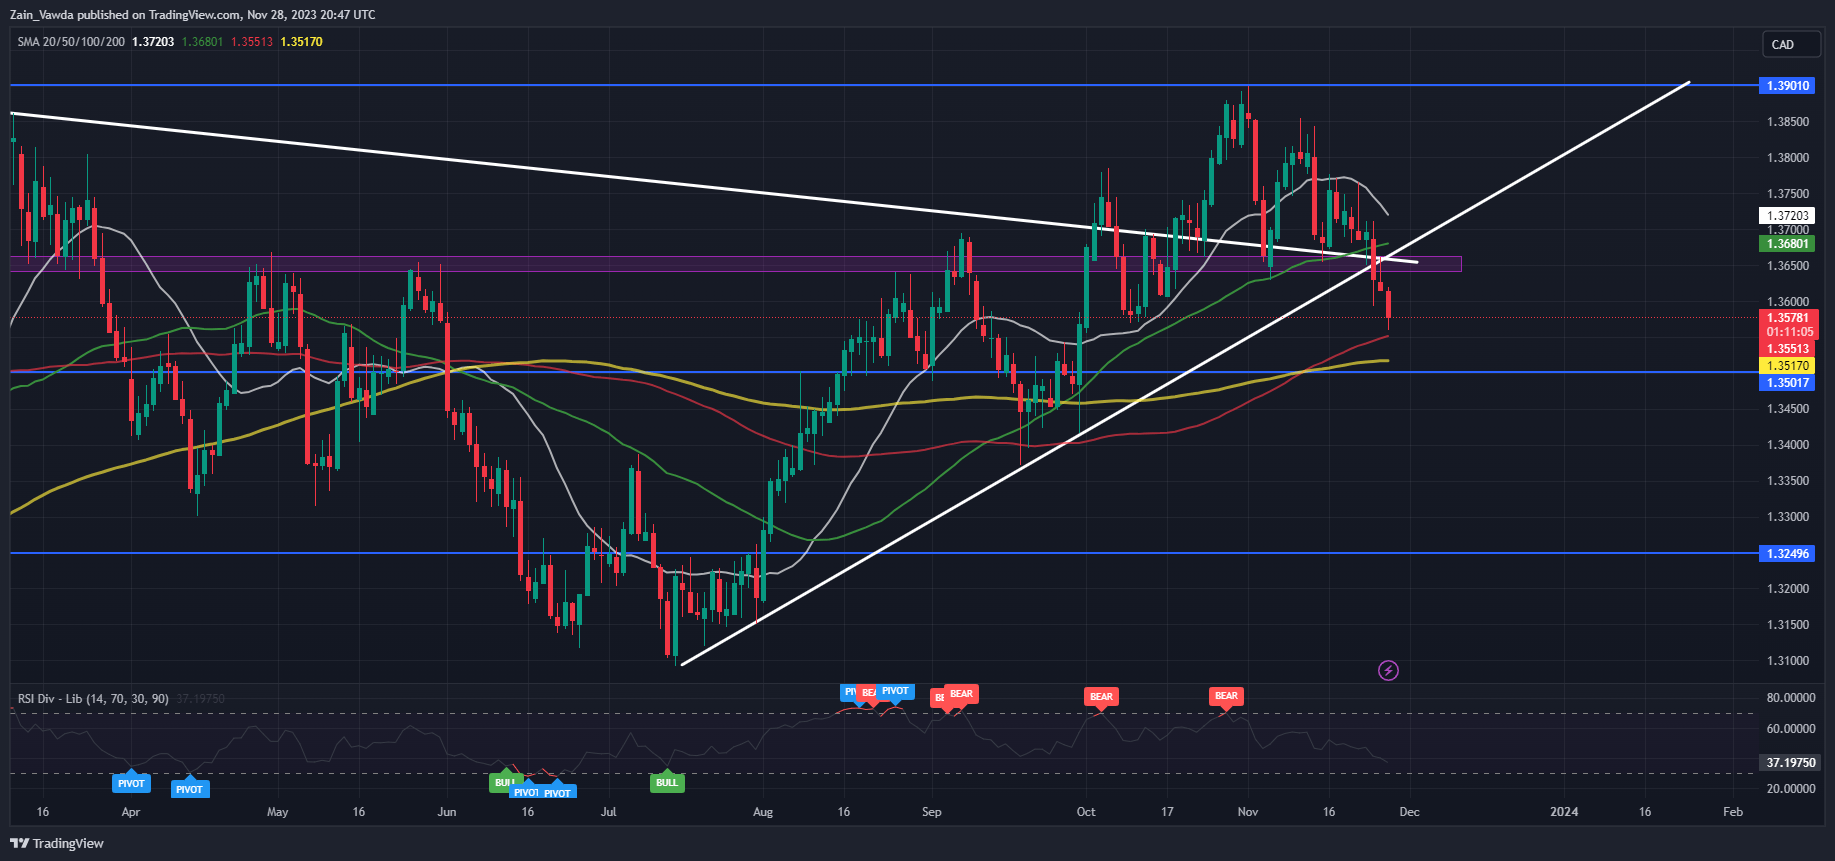
USDCAD Continues its slide today helped by a weaker US Dollar and a rebound in Oil prices. Having broken the ascending trendline on Friday the selloff has gathered a bit more momentum but faces some technical hurdles ahead.
Despite more uncertainty from OPEC+ today Oil prices did bounce just below the $75 a barrel mark. WTI was up around 1.9% at the time of writing which is bit surprising given rumors today that OPEC+ is still having disagreements regarding quotas for 2024. The rumors also stated a potential delay of this week’s virtual meeting and the potential for output and supply to remain steady in 2024. Time will tell.
Trade Smarter – Sign up for the DailyFX Newsletter
Receive timely and compelling market commentary from the DailyFX team
Subscribe to Newsletter
GDP DATA, FED SPEAKERS AND CANADIAN EMPLOYMENT DATA
Unlike many pairs this week USDCAD faces a host of risk events which could impact price action moving forward. Today however was largely dominated by comments from Federal Reserve policymakers with a largely dovish tone. Market expectations added an extra 5bps of rate cuts in 2024 as a result with comments from Policymaker Waller who stated, ‘there’s good economic arguments that if inflation continues falling for several more months, you could lower policy rate.’ There was the odd hawkish comment as well with known hawk Michelle Bowman citing concerns around services consumption and whether or not supply-side advances will curb inflation.
The Dollar Index (DXY) hit its lowest level since August and breaking below a key support area. As US Yields, the 2 and 10 year in particular continuing to slide keeping the Dollar subdued as well.
Tomorrow brings the 2nd estimate of Q3 US GDP which could stoke volatility but only if there is some revision to the 1st estimate. More importantly for USDCAD however, could be Canadian GDP and employment data released on Thursday and Friday respectively. I will also be keeping an eye of Federal Reserve Policymakers who are scheduled to speak later this week. After the move we saw today it would be remiss to ignore the impact these comments could have.
Customize and filter live economic data via our DailyFXeconomic calendar
TECHNICAL ANALYSIS USD/CAD
USDCAD finally broke the ascending trendline which had been in play since July. Having broken the trendline Monday did present a retest opportunity before a further selloff today bringing USDCAD within touching distance of the 100-day MA.
There is the possibility of retracement from here before resuming its move to the downside and the 1.3500 psychological level. If price is able to break above the psychological level then support rests at 1.3450 and 1.3370 respectively.
As mentioned, a push higher from here faces resistance around the 1.3640 area and just above we have the 50-day MA resting at the 1.3680 handle.
Key Levels to Keep an Eye On:
Support levels:
Resistance levels:
USD/CAD Daily Chart
Source: TradingView, prepared by Zain Vawda
IG CLIENT SENTIMENT
Taking a look at the IG client sentiment data and we can see that retail traders are committed to neither LONGS or SHORTS with 50% of Traders holding both BUYS and SELLS. A sign that a retracement may be incoming or just caution ahead of the data releases?
For Tips and Tricks on How to use Client Sentiment Data, Get Your Free Guide Below
| Change in | Longs | Shorts | OI |
| Daily | 15% | -13% | -1% |
| Weekly | 17% | -16% | -3% |
— Written by Zain Vawda for DailyFX.com
Contact and follow Zain on Twitter: @zvawda


