
Here’s one for the gold bugs out there!
The precious metal is back in consolidation mode, and it looks like a breakout is imminent soon.
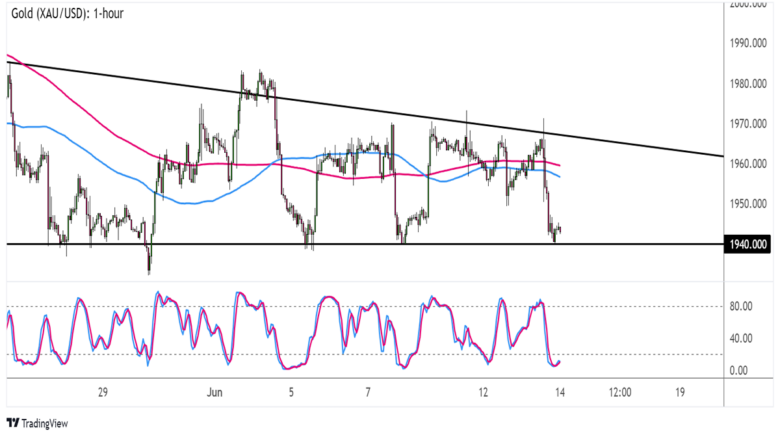
On the hourly timeframe below, you can see that the XAU/USD pair formed lower tops and found support around $1,940 to create a descending triangle pattern.
Gold (XAU/USD) 1 hour Planned by TV
The price is currently testing the triangle support again, and it is still deciding whether to bounce back to the resistance or go for a lower break.
Note that this floor has been holding for over two weeks already, so the gold bulls may be ready to charge in here.
However, technical indicators are giving mixed signals.
The 100 SMA is below the 200 SMA to indicate that the support is more likely to break than hold, possibly sending gold lower at the same height as the triangle formation.
On the other hand, the stochastic is already falling in the oversold zone to reflect exhaustion among the sellers. A shift to the upside would indicate that the bullish momentum could return and take XAU/USD back to the top of the triangle at $1,970.
Gold’s potential rally may also cap at the dynamic resistance levels of the moving averages around $1,950-1,960.
Don’t forget, the precious metal is coming out of a double top breakdown a while ago, so there could be a long-term bearish sentiment at play!