
USD/JPY looks ready to turn lower after retesting a broken technical support area.
Are we looking at a break-and-retest setup in the making?
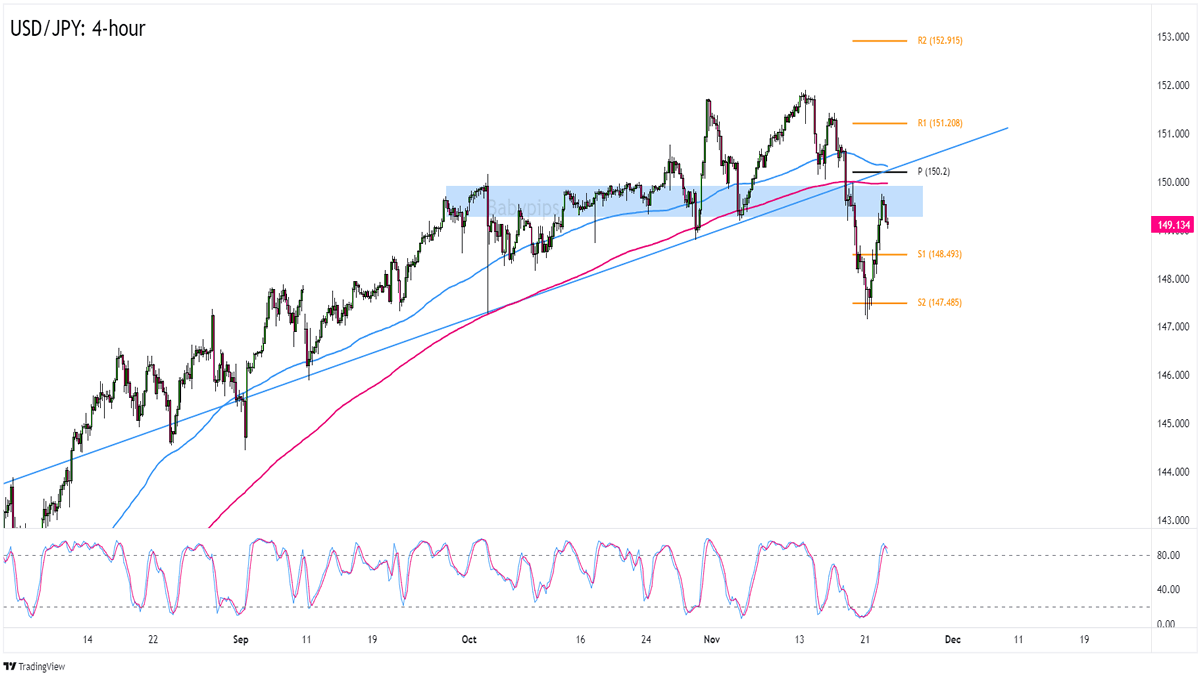
Let’s take a closer look at USD/JPY’s 4-hour time frame:
USD/JPY 4-Hour Forex Chart by TradingView
First, remember that directional biases and volatility conditions in trading are typically driven by fundamentals. If you lack a fundamental-based price outlook for USD/JPY, it’s time to do some digging by checking out the forex calendar and stay updated on daily fundamental news!
When you’re convinced that the U.S. dollar can keep losing pips against the Japanese yen, then you may want to look at USD/JPY potentially turning lower from just under the 150.00 mark.
Aside from being a psychological level, 150.00 also sits near the broken trend line support, the 4-hour chart’s 100 and 200 SMAs, and today’s Pivot Point (150.20) level.
The cherry on top of this potentially sweet bearish setup is Stochastic hanging out and turning lower from its “overbought” conditions.
USD/JPY’s current levels can attract selling pressure especially if we see a couple more bearish candlesticks in the next few hours.
The S2 (147.49) Pivot Point line is an area to watch as a possible profit target if USD/JPY gains bearish momentum.
But what if USD/JPY busts through the trend line, Pivot Point, and SMA resistance levels?
If your fundamental analysis points you to further gains for USD/JPY, then you may consider buying as soon as the pair comfortably clears the 150.00 resistance zone.
Profit-takers could eye the 151.85 previous highs in this case though USD/JPY bulls may also attract enough buying pressure to make new monthly highs.
Whichever bias you choose to trade, make sure you’re using your best risk management moves and following your trading plan like it’s your family’s best Thanksgiving recipe!