
Who’s up for some range trading today?
If you are, then you won’t want to miss EUR/JPY hitting a key resistance zone.
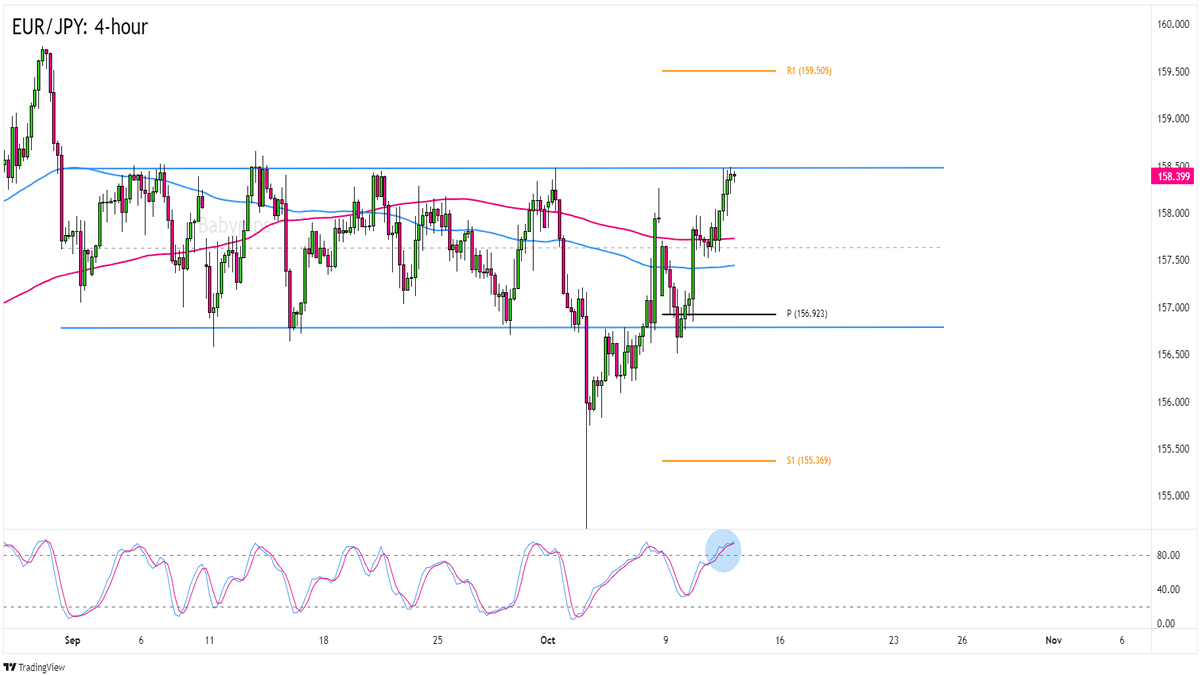
I mean, check out how this 4-hour chart looks:
EUR/JPY 4-hour Forex Chart by TV
October has been really good for EUR/JPY, with the pair recovering from its 155.00 lows all the way back to its September range.
Speaking of ranges, EUR/JPY is currently trading close to the 158.50 range resistance in the 4-hour time frame.
As you can see, it hasn’t been broken since the pair started trading between 156.80 and 158.50 at the start of September.
Will the range hold for another day? Stochastic is already giving “overbought” signals and it looks like the bullish candlesticks in the chart are losing steam.
A couple of bearish candlesticks just might attract enough EUR/JPY bears to drag the pair back to its 157.60 mid-range levels.
We may even see a trip back to the 156.80 range support if there’s enough momentum.
We won’t see top-tier data releases from the Eurozone or Japan in the next trading sessions, but we do have the U.S. CPI and UoM consumer inflation expectations releases as well as China’s inflation reports on tap.
The events may factor in the overall market sentiment and push EUR/JPY strongly in a single direction.
If a risk-friendly environment persists and EUR/JPY makes a clean break above the range, then you can consider the 159.00 – 159.50 August highs as possible profit targets.
Whichever bias you end up trading, make sure to consider EUR/JPY’s average daily volatility and use your best risk management skills!