
Heads up to Equity Index playas!
The S&P 500’s massive rally at the end of October brought it back to the top of a falling channel.
What’s the pattern that may signal the bears held once again? Or is it time for the bulls to break higher?
We’re taking cues from the 4-hour chart today:
S&P 500 (US500): 4-Hour
S&P 500 (US500) 4-Hour Chart by TradingView
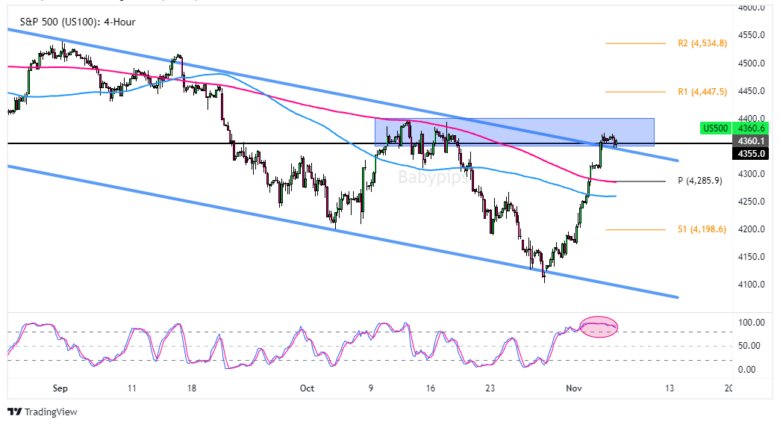
On the four hour chart of the S&P 500 Index (US500 CFD), we’ve got a pattern of lower ‘highs’ and lower ‘lows’, creating a textbook falling channel pattern. This is a trending price pattern, which is also signaled by the falling 100 and 200 simple moving averages.
We can also see that the current market levels are trading around the previous consolidation area from early October, and the stochastic indicator is signaling potentially overbought conditions at the moment. Both are also technical arguments that could draw in further sellers.
From a pure technical perspective, this may be an opportunity for bears to short the market at a better price than last week, which could attract a wide range of bears include those currently holding longer-term shorts and fresh sellers who’ve been waiting for a while.
And after a very strong run higher from the bottom of the channel last week, long position profit takers may potential sell out in this area as well. If so and the market goes bearish again, and with a daily average true range or around 60 points, a move to 4300 is a possibility (or even the Pivot Point at 4,285) within a few sessions.
Now, that’s the strong technical argument that sellers could take control again, but remember that volatility and market direction is mostly driven by fundamentals.
Fundamental catalysts can and often blow chart setups out of the water, so we have to consider the other side of the market as well.
For the bulls, an upside break of the technical confluence above is a pattern to watch out for. If this pattern plays out and ideally holds strong above the 4400.00 major psychological level, the odds rise of a drawing in buyers into a momentum move.
If that scenario plays out, the daily true range says that a move to R1 Pivot resistance at 4,447 is possible, and that a retest of the 4,500 major psychological level is also possible before the end of the week.
Again, it’s all up to the fundies so don’t forget to do your work there. And once you’re set on an outlook and strategy, don’t forget to also practice good risk management skills!