
Missed the neckline breakdown on crude oil?
If you’re still bearish on the commodity, this pullback might be an opportunity to short!
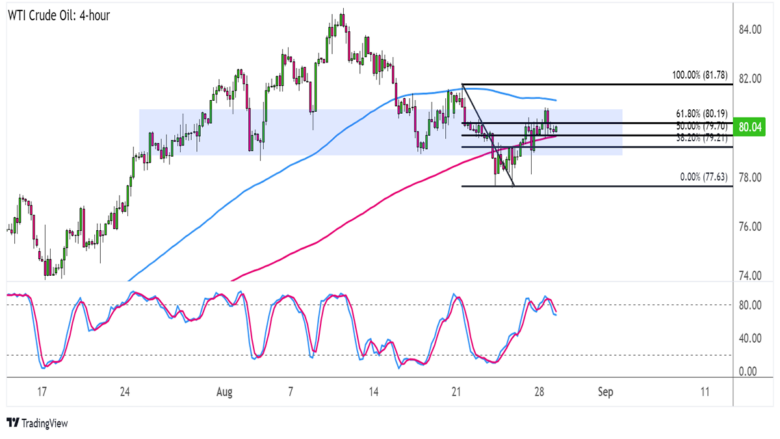
Check out this trend reversal setup on the 4-hour time frame!
WTI Crude Oil (USOIL) 4-hour Chart by TV
Crude oil fell through the neckline of its head and shoulders formation, hinting that a downtrend is in the cards.
It’s still in correction mode, though! The Fib retracement tool shows that this area of interest is right around the 61.8% level, which already appears to be attracting more bears.
If that’s the case, the commodity could soon make its way back to the swing low near $78 per barrel or fall by the same height as the chart pattern.
Stochastic is already pointing down from the overbought zone, which means that bearish vibes are ready to return while buyers are taking a break.
However, the 100 SMA is above the 200 SMA to suggest that the path of least resistance is to the upside. In other words, there’s still a slight chance the uptrend might resume.
It’s worth noting that the gap between the moving averages is narrowing to reflect slowing bullish pressure, and that the 100 SMA is turning lower to hint at a potential downward crossover.
Just make sure you keep tabs on overall market sentiment when trading this one!