
Gold was unable to sustain its consolidation breakout earlier on, creating a reversal pattern instead.
Will we see confirmation soon?
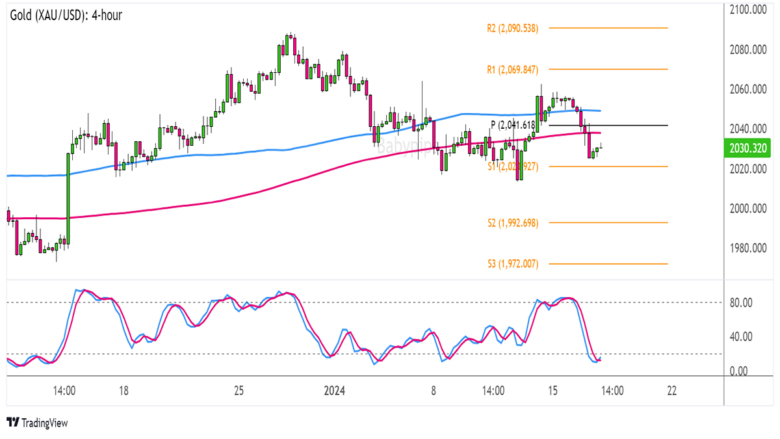
As you can see from the 4-hour chart below, XAU/USD is completing the second shoulder on its head and shoulders formation.
Better keep tabs on this neckline support to gauge if a downtrend might follow.
Gold (XAU/USD) 4-hour Chart by TradingView
The precious metal barely gained any traction from its bullish triangle breakout last week, as price slid back to the support zone around $2,020.
That’s no surprise, given how market sentiment has been fickle recently, taking cues from shifting Fed policy expectations and intermarket developments.
Remember that directional biases and volatility conditions in market price are typically driven by fundamentals. If you haven’t yet done your fundie homework on gold, then it’s time to check out the economic calendar and stay updated on daily fundamental news!
XAU/USD is inching closer to testing the neckline support at S1 ($2,020.97) and a break below this could confirm that a downtrend might be in order.
In that case, gold could set its sights on the next bearish targets at S2 ($1,992.70) then S3 ($1,972.01) near last month’s lows.
A bounce off support, on the other hand, could put gold on track towards testing the area of interest near R1 ($2,069.85) or the previous highs at R2 ($2,090.54).
Technical indicators are leaning in favor of a climb, as the 100 SMA is above the 200 SMA while Stochastic looks ready to bottom out at the oversold region. Still, price is trading below both moving averages and the pivot point level ($2,041.62) as an early indication of downside pressure.
Just make sure you keep tabs on upcoming market catalysts, including today’s U.S. retail sales report, and overall sentiment when trading this precious metal!