
Did you miss the EUR/NZD double bottom breakout?
If you remain bullish on this pair, you may have a chance to catch the rally on this pullback!
Check out these support levels as buyers may be looking to jump in.
Trade EUR/NZD for 1 hour Planned by TV
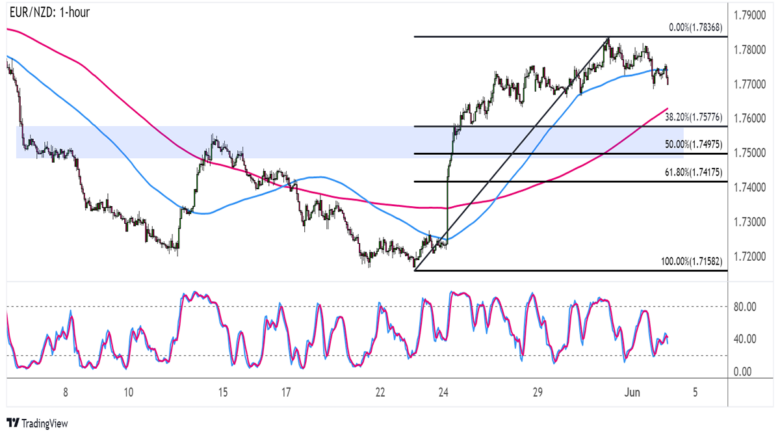
I am looking forward to this nice correction setup on the hourly chart of the EUR/NZD, as the Fibonacci tool highlights areas of interest.
In particular, I have my eye on the 50% level as it lines up with the broken neckline of a double bottom chart pattern and sits near the key psychological support at 1.7500.
The bigger correction might reach 61.8% Fibonacci just above the 1.7400 mark, but this line might be in the sand for a bullish pullback.
The 100 SMA is above the 200 SMA to indicate that the support levels are more likely to hold than to be broken, so EUR/NZD may find its way back to the swing top after 1.7800 soon.
At the same time, the stochastic is already moving up, so the pair can follow suit until overbought conditions are met.
Just be sure to practice proper risk management and take EUR/NZD daily fluctuations in mind when trading this!