
The Dollar and Loonie both have a busy schedule ahead, making this textbook technical setup on USD/CAD one to watch for both bulls and bears?
Will the downside break be extended or could there be a bounce ahead?
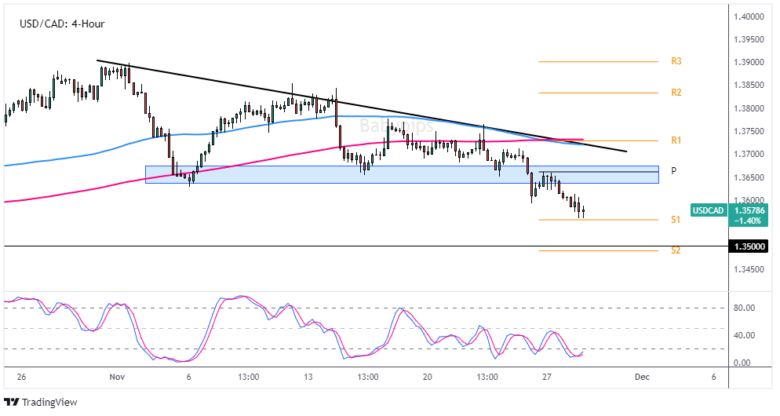
USD/CAD: 4-Hour
USD/CAD 4-Hour Forex Chart by TradingView
Based on our latest Week Ahead in FX post, it’s gonna be a busy one for the forex markets, especially for the U.S. dollar and the Canadian dollar.
Aside from central bank speak, Greenback traders will likely see volatility from U.S. GDP and core PCE Price Index updates, while Loonie traders have Canadian GDP and the employment updates to work with.
Remember that directional biases and volatility conditions in market price are typically driven by fundamentals. If you haven’t yet done your fundie homework on USD/CAD, then it’s time to do some work by checking out the forex calendar and stay updated on daily fundamental news!
If you have done your fundies homework, then it’s time to move to the charts!
On the 4-hour chart above, we can see USD/CAD has been under selling pressure in November. But there were buyers holding the line pretty well between 1.3650 – 1.3700, before it eventually broke this past week.
Given the downtrend in USD/CAD and likely pick up in volatility, this area is one to watch for the bears in case the market bounces higher to better shorting prices, a probable technical scenario given that the S1 pivot support level and oversold stochastic signal may draw in some technical traders, or even short-term profit takers.
If we do see a bounce and retest of the broken support area, that’s where bears should really look for short selling triggers as it also includes other technical arguments that may draw in further selling orders.
Aside from the broken support area / minor psychological level, we can see that the weekly Pivot Point and falling ‘highs’ trendline also lines up in that area.
And at the upper end of that area, we can also see moving averages, which could draw in technical sellers as well, especially with the 100 SMA crossing below the 200 SMA.
A retest and developing bearish reversal patterns may draw in further selling at the at point, but once again, it’s likely up to the fundies on whether that area holds as resistance or not.
And if the fundies sustainably pushes the pair above that technical confluence area roughly between 1.3650 – 1.3250, then we could see fresh technical buyers jumping in on USD/CAD, along with potential short position profit taking.
If so and upside momentum picks up, then a move to 1.3800 – 1.3850 may be in the cards, based on the daily average true range of around 75 pips and if fundamental players go bullish on the pair.
But what do you think? We love to hear everyone’s ideas so feel free to drop a comment below and share your thoughts!