
This forex pair has been pacing inside its range for quite some time and is currently testing the top.
Is it in for a bounce or a break next?
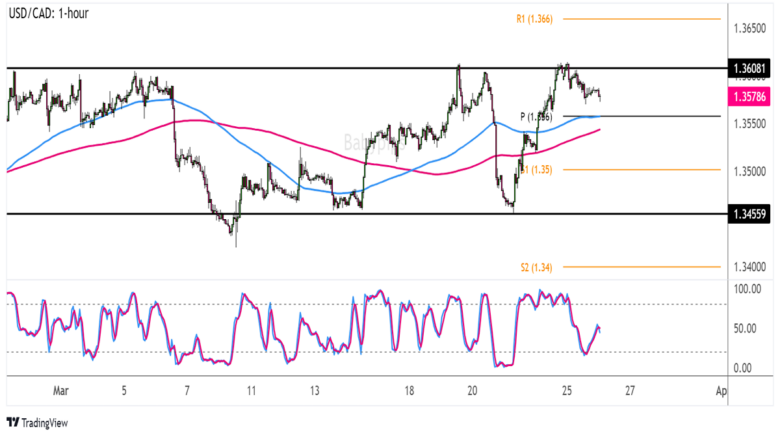
Check out these inflection points I’m watching on the hourly time frame.
USD/CAD 1-hour Forex Chart by TradingView
USD/CAD has been tossing and turning these days, taking cues from crude oil rallies while also adjusting to shifting policy bets.
In particular, easing expectations for the Bank of Canada (BOC) have been on the rise recently, as the country’s inflation reports fell short of estimates.
Meanwhile, geopolitical tensions continue to keep investors on edge about global supply risks, especially after the OPEC+ already agreed to extend its output deal through June.
Remember that directional biases and volatility conditions in market price are typically driven by fundamentals. If you haven’t yet done your fundie homework on the U.S. dollar and Loonie, then it’s time to check out the economic calendar and stay updated on daily fundamental news!
Another round of gains for crude oil could also lift the correlated Loonie, dragging USD/CAD to the bottom of its range near the 1.3450 minor psychological mark or at least until the support zones at the middle.
The 100 SMA dynamic support lines up with the pivot point level (1.3560) while S1 (1.3500) is right on a major psychological mark. The 100 SMA is above the 200 SMA to suggest that support zones are more likely to hold than to break.
Stochastic is already on the move up, too, which means that buyers have the upper hand until overbought conditions are met. With that, a break past the range resistance at the 1.3600 handle could spur a move to the upside targets at R1 (1.3660) or higher.
Good luck and good trading this one!