
Basic overview
Crude oil reversed all its losses from the last week of May, when the market fell, despite OPEC+ extending voluntary production cuts, with the price falling out of a full month's range. It is possible that the decline was purely technical, as downward momentum increased after the breakout. The price eventually bottomed around $73 and is currently returning to the crucial resistance level of $80.
The market was also supported by the recent strong US NFP report, which showed that demand is likely to remain strong amid a rebound in global growth as also indicated by the PMIs. Moreover, some major central banks have begun to ease their policies, and China is likely to continue to do so as deflationary forces persist.
In the big picture, better growth prospects and positive risk sentiment should be tailwinds for the market, but we must first break through the key resistance at $80 to further boost the bullish momentum.
Technical analysis of crude oil – daily time frame
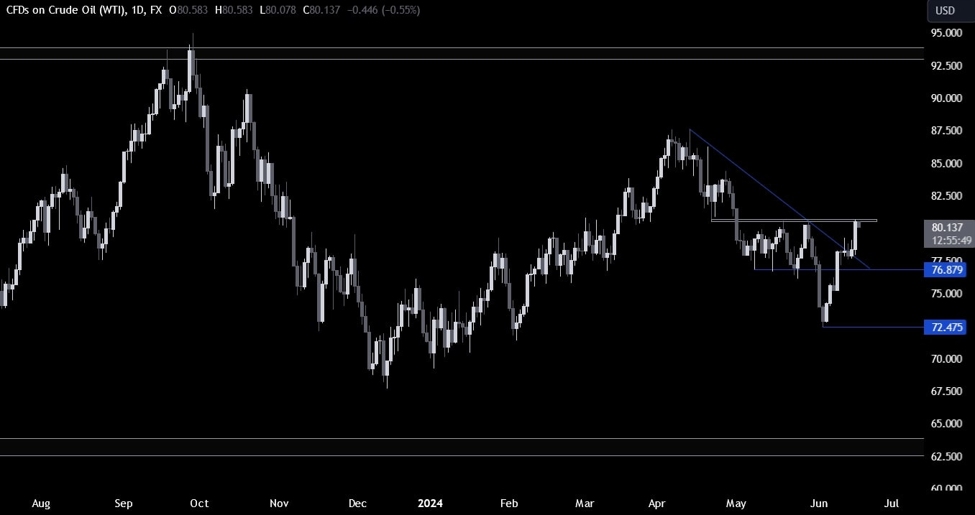
Crude oil daily
On the daily chart, we can see that crude oil saw a V-shaped recovery from 72.50 level with bullish momentum building after the strong NFP report in the US and the breakout of the trend line.
Price is now rejecting key resistance around the 80 level as sellers start stacking specific risks above the resistance to put them in a position to break to new lows with a better risk to reward setup. Buyers will want to see the price rise higher to gain more conviction and increase bullish bets to new highs.
Technical analysis of crude oil – 4-hour time frame
Crude oil 4 hours
On the 4-hour chart, we can see that we now have an uptrend line outlining the current uptrend. If we get a pullback to the trend line, we can expect buyers to rely on it with specific risks below it to place their position for a continuation of the rally and a break of the 80 resistance level.
On the other hand, sellers will want to see the price break down to increase bearish bets to the 77 support level and target a breakout below it.
Technical analysis of crude oil – 1 hour time frame
Crude oil 1 hour
On the 1-hour chart, we can see that we also have the meeting area of the 50% and 61.8% Fibonacci retracement levels around the trend line. This should technically strengthen support around the 79 level, so it will be a key area to watch if the price drops to it. The red lines mark the average daily range for the day.
Upcoming stimuli
Today we have American retail sales and American industrial production. On Thursday, we will get US housing starts, building permits and the latest US unemployment claims numbers. On Friday, we conclude the week with US PMIs.