Article by IG Senior Market Analyst Axel Rudolph
FTSE100, DAX 40, S&P 500 Analysis and Charts
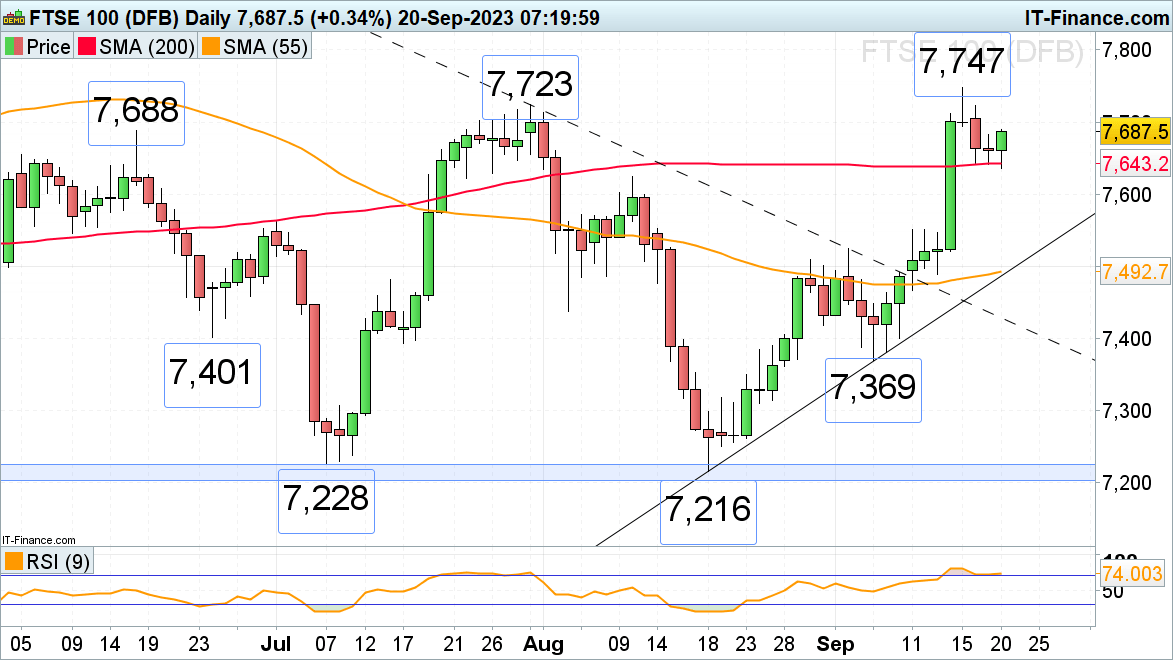
FTSE 100 recovery underway
The FTSE 100 is recovering from this week’s low at 7,369 amid rising oil and commodity prices and as the governor of the Bank of England (BoE), Andrew Bailey cast doubt on the need for further rate hikes. The breached July-to-September downtrend line, because of inverse polarity a support line – now at 7,366 – offered support this week with an attempt to reach the 55-day simple moving average (SMA) at 7,474 currently underway. Above it lurks the July-to-September resistance line at 7,493 and also at Monday’s 7,524 high. This level would need to be bettered for the 200-day SMA to come back into play.
Minor support sits at the late August 7,419 low.
FTSE 100 Daily Chart
Recommended by IG
Top Trading Lessons
DAX 40 tries to stabilize
The DAX 40 had a difficult week for bulls as Euro Zone growth worries, a rising US dollar and yields weighed on sentiment and led to an over 2% drop in the index from its late August high at 16,044. While Thursday’s 15,650 low holds on a daily chart closing basis on Friday, though, the 24 August high at 15,895 may be revisited. Slightly further up the July-to-September uptrend line and 55-day simple moving average (SMA) can be spotted a 15,916 to 15,928.
Were this week’s low at 15,650 to fall through on a daily chart closing basis, the August lows and 200-day SMA at 15,545 to 15,469 would be in sight.
DAX 40 Daily Chart
Download the Free IG Sentiment Report
| Change in | Longs | Shorts | OI |
| Daily | -6% | 1% | -2% |
| Weekly | 27% | -5% | 6% |
S&P 500 tries to stem decline ahead of weekend
Following four straight days of declining prices, the S&P 500 may try to find support above Thursday’s low at 4,430 amid short-covering ahead of next week’s US consumer price index publication. A rising US dollar and treasury yields, along with China’s ban on iPhone usage for government officials weighed on the index this week as did rising probabilities of another Federal Reserve (Fed) rate hike before the year is out. On Thursday the former Federal Reserve Bank of St. Louis President James Bullard said that policymakers should stick to their plan for one more rate hike.
While this week’s low at 4,430 holds, a bounce back toward the 55-day simple moving average (SMA) at 4,474 may ensue. This level coincides with the 24 August high. Further up lies the psychological 4,500 mark ahead of the current September peak at 4,540.
A fall through 4,430 would push the March-to-September uptrend line at 4,402 to the fore.
S&P 500 Daily Chart
Recommended by IG
The Fundamentals of Trend Trading


