Gold (XAU/USD) and Silver (XAG/USD) Analysis, Prices, and Charts
- Gold continues to struggle at multi-month lows.
- US Jobs Report is the next macro-driver on the economic calendar.
Download the Brand New Q4 Gold Forecast
Recommended by Nick Cawley
Get Your Free Gold Forecast
The US dollar is drifting lower in early trade as US yields slip, but the greenback’s technical outlook remains bullish for now. All eyes now are on Friday’s US Jobs Report.
Longer-dated US Treasury yields remain elevated but have given back a few basis points today after this week’s sharp rise. The supply/demand imbalance seen in longer-dated USTs has driven yields higher as the remaining buyers continue to demand more yield to take on American debt in the face of increased issuance. Short-end US Treasury yields remain underpinned by the current 500-525 Fed Fund rate and warnings by various hawkish central bank members that another 25 basis point hike is likely this year, especially if the US labor market remains robust. Tomorrow’s US NFP report will be closely watched by US bond traders.
DailyFX Economic Calendar
The US dollar remains in an uptrend ahead of tomorrow’s jobs report with any past pullbacks used as a buying opportunity. A break below 105.48 would put this trend in doubt.
US Dollar Index Daily Chart – October 5, 2023
Recommended by Nick Cawley
How to Trade Gold
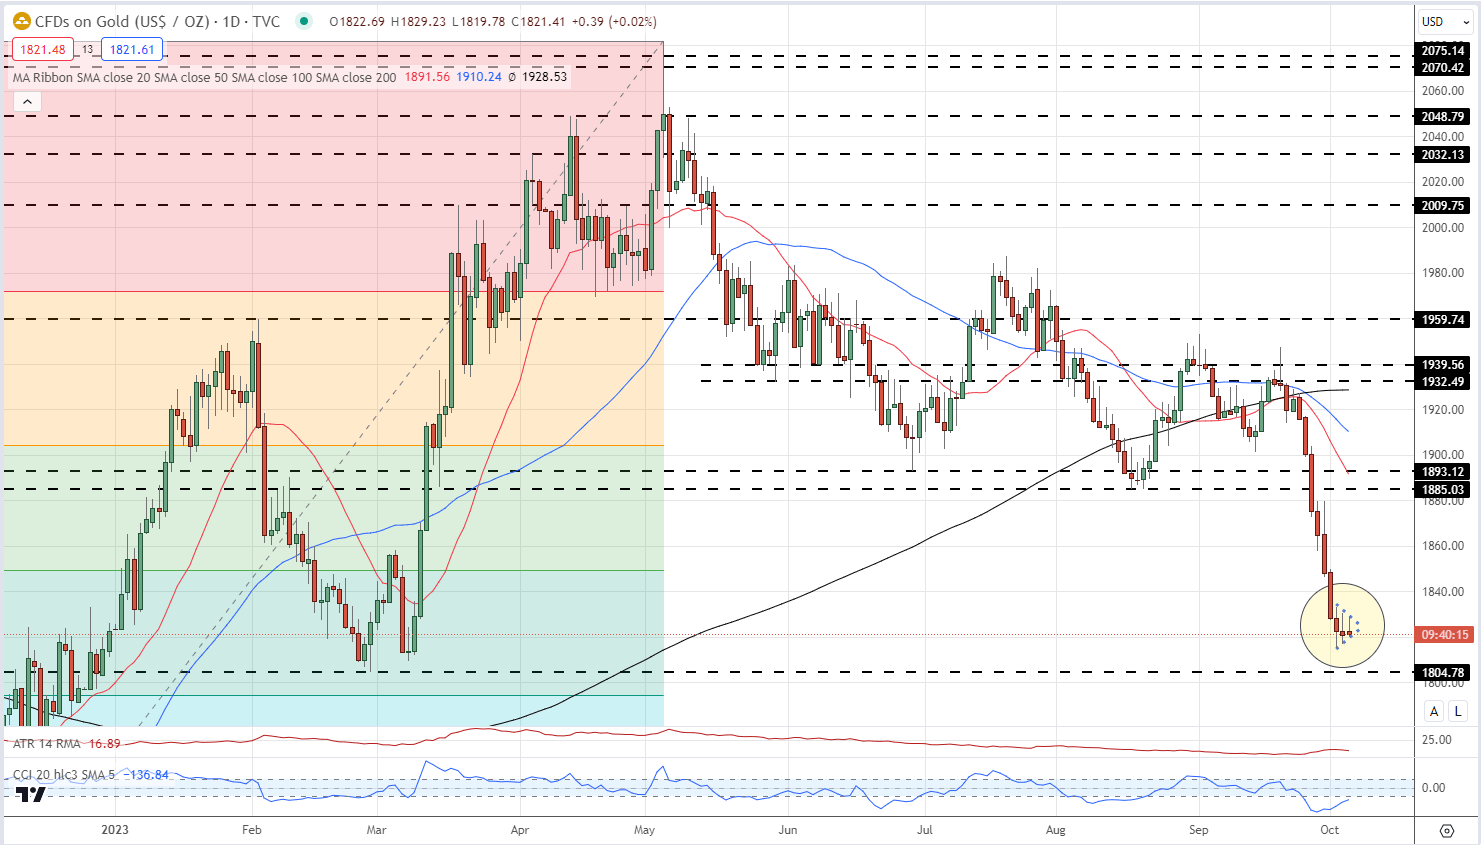
The technical outlook for gold remains negative despite being oversold. Eight red candles in a row has pushed the precious metal into oversold territory, using the CCI indicator, which may allow for a period of consolidation, but a short-term bearish pennant pattern is warning of further downside. Support seen just above $1,800/oz. and the 61.8% Fibonacci retracement at $1,794/oz.
Gold Daily Price Chart – October 5, 2023
Gold Sentiment is Moving – See the Latest Sentiment Guide
| Change in | Longs | Shorts | OI |
| Daily | 2% | -7% | 1% |
| Weekly | 18% | -23% | 11% |
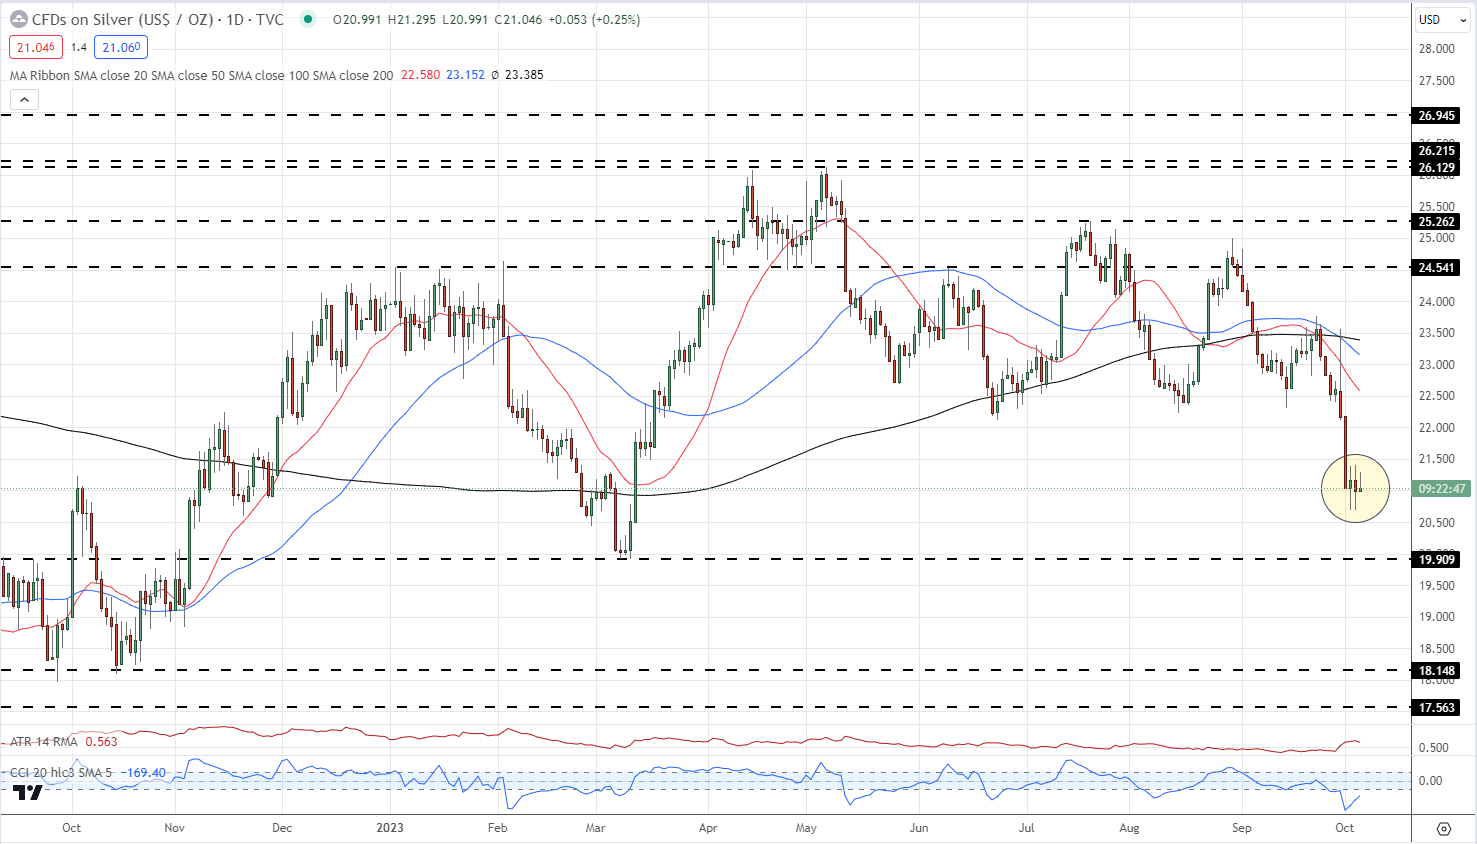
Silver is also under pressure and is heading towards the March 8th swing low at $19.91. The sharp sell-offs seen last Friday and this Monday have pushed silver into heavily oversold territory and have also formed a bearish pennant pattern, although not as perfect as gold. Lower lows and lower highs dominate the chart from early May, leaving silver vulnerable to further falls.
Silver Daily Price Chart – October 5, 2023
Charts via TradingView
What is your view on Gold and Silver – bullish or bearish?? You can let us know via the form at the end of this piece or you can contact the author via Twitter @nickcawley1.


