US DOLLAR FORECAST – EUR/USD, GBP/USD, AUD/USD
- The U.S. dollar extends losses, sinking to its weakest point since early August
- Meanwhile, EUR/USD, GBP/USD and AUD/USD break out to the topside, clearing key price levels in the process
- This article focuses on the technical outlook for top forex pairs
Trade Smarter – Sign up for the DailyFX Newsletter
Receive timely and compelling market commentary from the DailyFX team
Subscribe to Newsletter
Most Read: US Dollar Outlook – PCE, Powell to Set Market Tone, Setups on EUR/USD, USD/JPY
The U.S. dollar, as measured by the DXY index, retreated for a fourth straight trading session on Tuesday, settling below the 103.00 threshold and hitting its lowest level since early August, pressured by a pullback in U.S. Treasury yields.
In recent days, U.S. interest rate expectations have shifted in a more dovish direction on bets that the FOMC has finished hiking borrowing costs and will move to ease its stance next year. This sentiment gained momentum today after Federal Reserve Governor Christopher Waller, typically a hawkish voice, stated that he is “increasingly confident” that monetary policy is in the right place and that, if inflation continues to slow, rate cuts could be considered.
Against this backdrop, the euro, British pound, and Australian dollar posted solid gains against the greenback, with their exchange rates breaching key levels in the process. In this article, we analyze the technical outlook for EUR/USD, GBP/USD, and AUD/USD, taking into account market sentiment, price action dynamics and chart formations.
Unsure about the U.S. dollar’s trend? Gain clarity with our Q4 forecast. Request your complimentary guide today!
Recommended by Diego Colman
Get Your Free USD Forecast
EUR/USD TECHNICAL ANALYSIS
EUR/USD extended its advance on Tuesday, clearing Fibonacci resistance at 1.0960 and rising to its best mark in more than three months. If the pair holds onto recent gains and establishes a support base near 1.0960, there’s a possibility of an upward push towards 1.1080 following a period of consolidation. Should bullish momentum persist, attention could turn to the 2023 highs near 1.1275.
In case of a downward shift from current levels, it is imperative to closely monitor price action around 1.0960, bearing in mind that a breach of this technical zone could send the exchange rate towards 1.0840. On further weakness, we could witness a retreat towards the 200-day simple moving average, located slightly above confluence support near 1.0760.
For a comprehensive assessment of the euro’s medium-term technical and fundamental outlook, request a free copy of our latest forecast!
Recommended by Diego Colman
Get Your Free EUR Forecast
EUR/USD TECHNICAL CHART
EUR/USD Chart Created Using TradingView
Interested in understanding how retail positioning may shape GBP/USD’s trajectory? Our sentiment guide examines crowd psychology in FX markets. Download your free guide now!
| Change in | Longs | Shorts | OI |
| Daily | -15% | 2% | -6% |
| Weekly | -22% | 15% | -3% |
GBP/USD TECHNICAL ANALYSIS
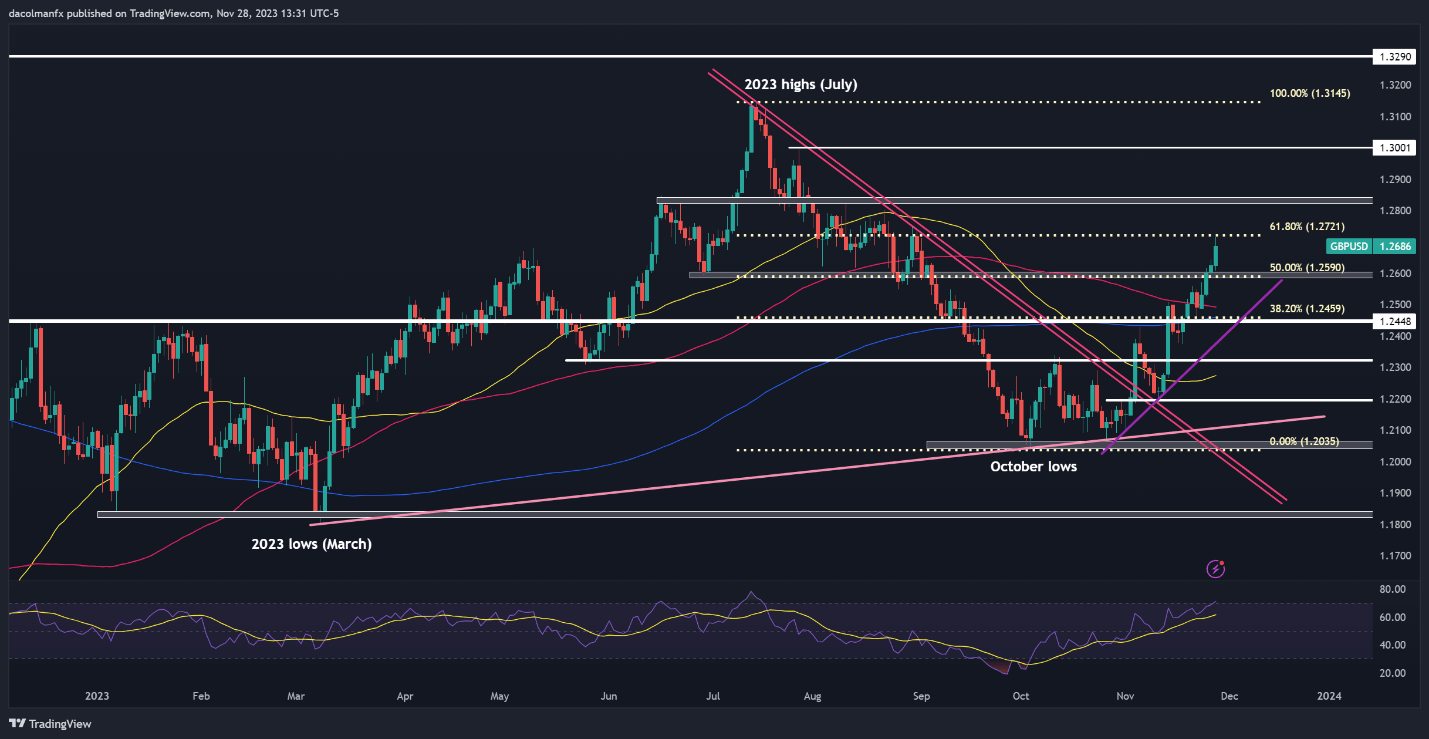
GBP/USD has been on a bullish tear in November, rising nearly 4.5% since the beginning of the month. After Tuesday’s gains, the pair has reached its best level since late August, but has been unable to reclaim the 61.8% Fibonacci retracement of the July/October slump (1.2720). If this ceiling holds, the upside momentum could run out of steam, paving the way for a drop towards 1.2590, followed by 1.2460.
In the event of a clear break above 1.2720, sentiment on sterling is likely to improve, unleashing animal spirits that could propel a potential upward move towards 1.2850. On further strength, buying interest could accelerate, opening the door to a climb toward the 1.3000 handle. Although the bullish case for GBP/USD is strong, it is important to exercise caution as the pair is about to enter overbought territory.
GBP/USD TECHNICAL CHART
GBP/USD Chart Created Using TradingView
Curious about what’s on the horizon for the Australian dollar? Get all the answers in our quarterly forecast!
Recommended by Diego Colman
Get Your Free AUD Forecast
AUD/USD TECHNICAL ANALYSIS
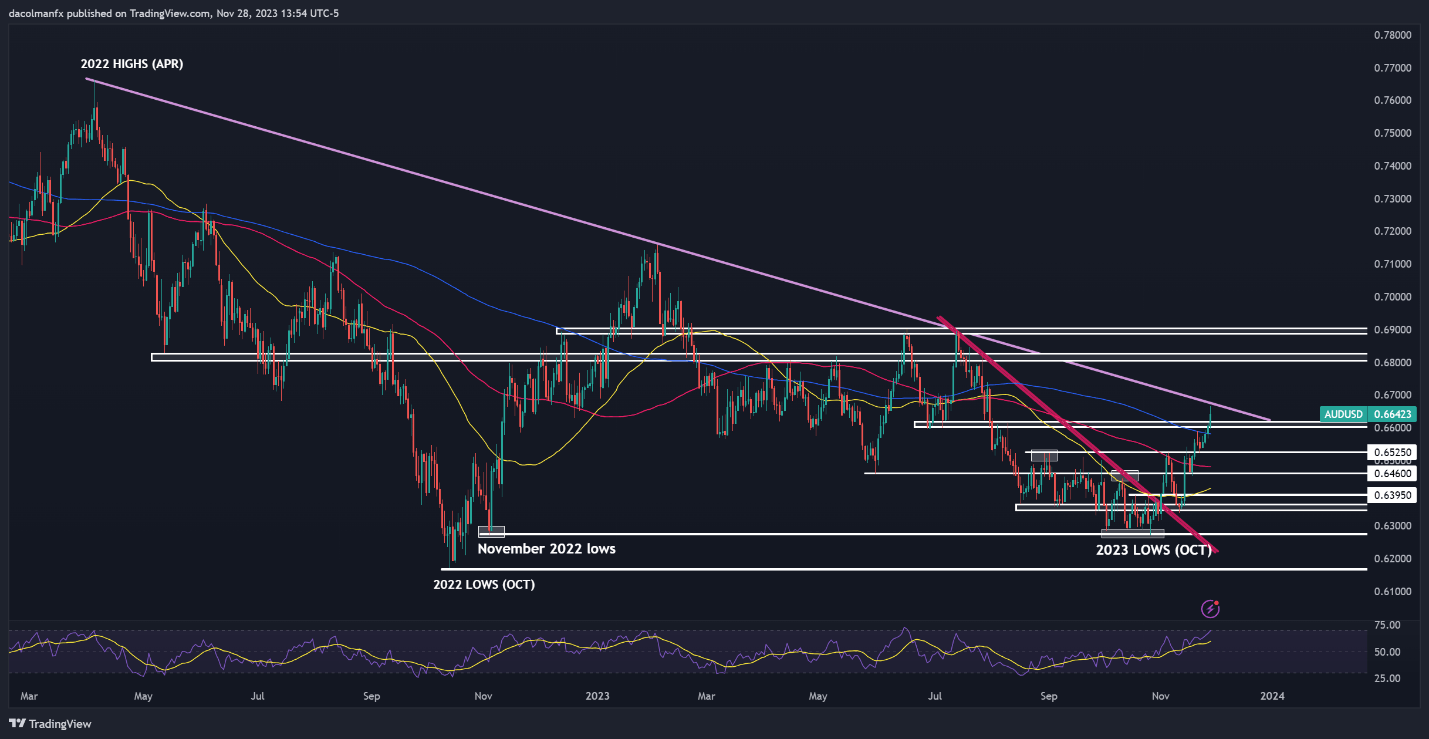
AUD/USD jumped on Tuesday, breaching a key technical ceiling in the 0.6600-06620 band and reaching its strongest level in nearly four months. The bulls have been burned on several occasions by fakeouts in the pair, so caution is warranted after the latest rally, but if this week’s breakout holds, attention might pivot toward trendline resistance at 0.6675. Higher, the focus will be on 0.6800.
Conversely, if profit-taking among bullish traders leads to a price reversal, support appears in the 0.6620/0.6600 area. If this floor caves in, we could see a retracement towards the 200-day simple moving average, potentially followed by a retest of the 0.6525 region. Vigorous defense of this support zone is crucial for the bulls, as a breakdown could trigger a pullback towards 0.6460.


