DXY, EUR/USD, GBP/USD PRICE, CHARTS AND ANALYSIS:
Most Read: Bitcoin Steady as Coinbase (Coin) Emerges as Winner from Binance Saga
Recommended by Zain Vawda
The Fundamentals of Trend Trading
US DOLLAR FUNDAMENTAL BACKDROP
The US Dollar Index (DXY) has struggled to maintain the upside momentum it gained over the last 2 days. This could in part be down to the Thanksgiving Holiday and we could get a continuation of the recent bounce heading into next week.
The US Dollar has struggled on the back of weakening data over the past few weeks as markets continue to grapple with the possibility that Federal Reserve are done. Yesterdays rebound was helped further by a decline in initial jobless claims which may keep the demand environment strong and thus hamper the fight against inflation.
The week is coming to an end with no high impact data releases from the US and although we will get a slight rebound in trading volumes tomorrow, there is every chance we remain rangebound heading into the weekend.
PRICE ACTION AND POTENTIAL SETUPS
US Dollar Index (DXY)
The US Dollar Index is caught between the 100 and 200-day MA which is why I suggested above we could continue to see rangebound trade ahead of the weekend. As things stand it is looking more and more likely that we will need some form of catalyst to facilitate a break in either direction.
Immediate resistance rests at 104.24 with the 20-day MA resting higher at the 105.00 psychological level. An attempted break to the downside has support to contend with at 103.616 with a key area of support resting around the 103.00 zone.
DXY Daily Chart
Source: TradingView, prepared by Zain Vawda
Recommended by Zain Vawda
How to Trade EUR/USD
EURUSD
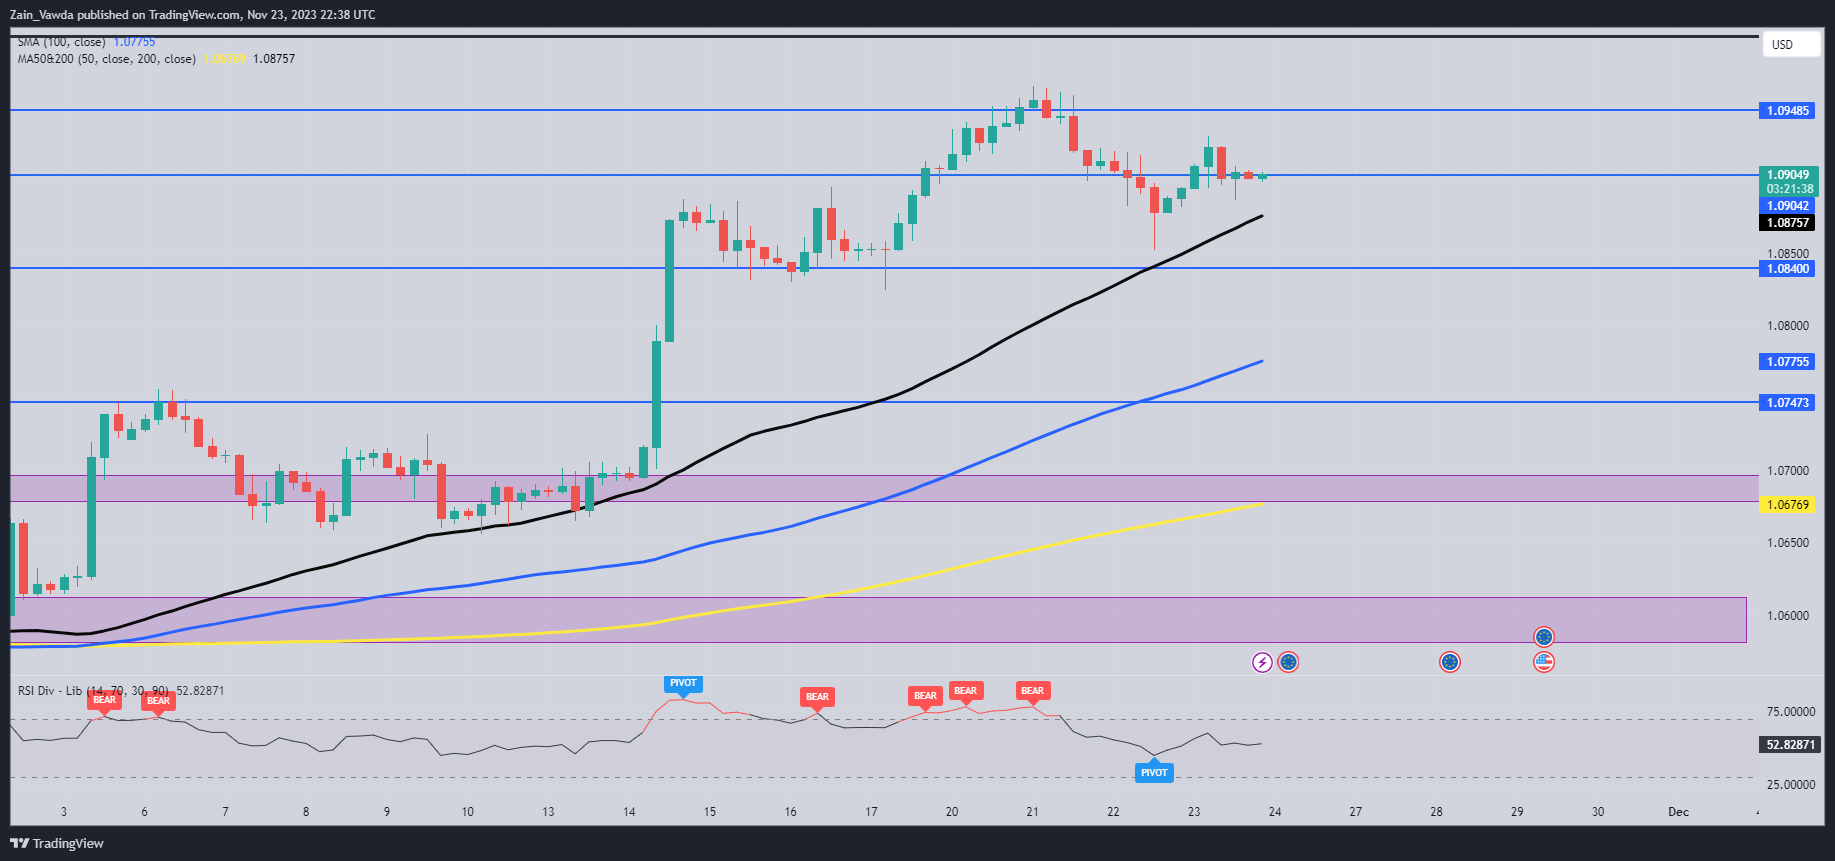
Now given the thin liquidity and rangebound price action of late, I thought we could break down EURUSD on the H4 timeframe. The H4 itself has been giving some mixed signals with Higher lows followed up by lower highs pointing to the current indecision in USD denominated pairs.
The 50-day MA to the downside may provide support and an opportunity for potential longs around the 1.08757 level or if we are to get a deeper retracement down to the 1.0840 handle. Short opportunities that potentially provide the best risk to reward may come into play if EURUSD retests 1.0950. Personally, I prefer to abide by the age-old adage “the trend is your friend” and thus would prefer potential long opportunities pending a pullback.
Key Levels to Keep an Eye On:
Support levels:
Resistance levels:
EUR/USD Four-Hour Chart
Source: TradingView, prepared by Zain Vawda
GBPUSD
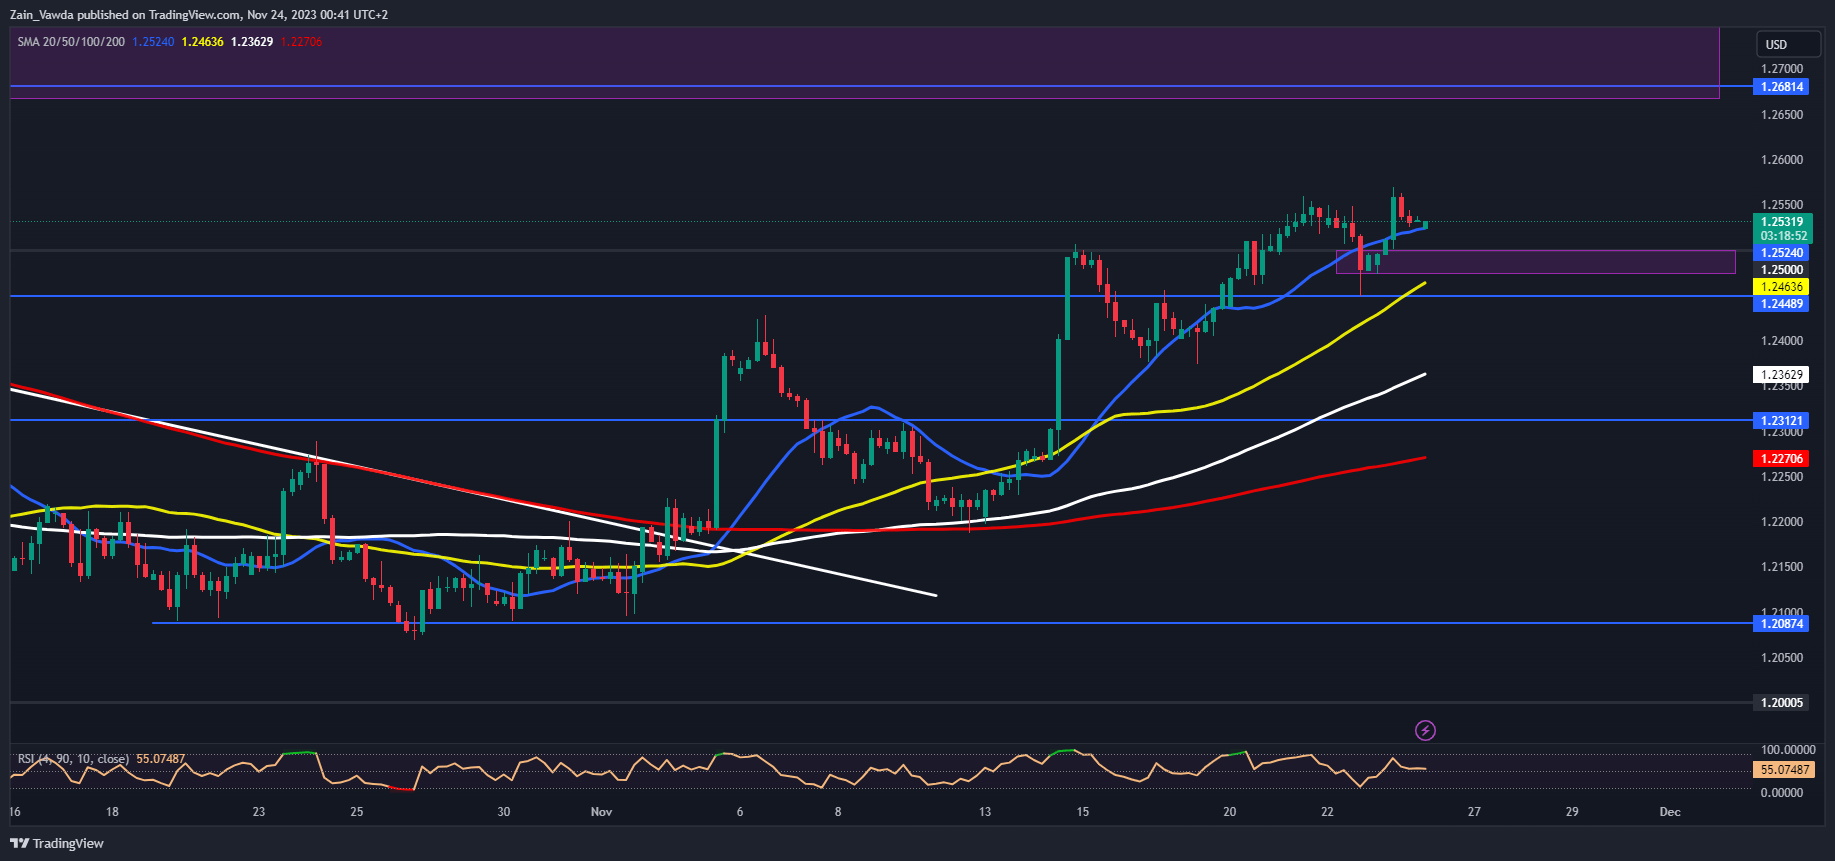
GBPUSD is a bit clearer as we can see a clear pattern of higher highs and higher lows this week. The question will be whether bulls have one more push to the upside and push Cable toward the 1.2600 handle.
As you can see on the chart below the pink box, I have drawn in just below the current price and touching the 50-day MA would be my preferred area for potential longs. This would provide a better risk to reward and would complete a lower high print.
If we do break below the 50-day MA we have support at the 1.2400 mark and lower at the 1.2360 mark. A selloff ahead of the weekend may also be on the cards as this would be down to profit taking as buyers who got in during the early part of the week may want to close out before the weekend. A lot will depend on the return of liquidity tomorrow and how much risk market participants are willing to take before the weekend.
GBP/USD Four-Hour Chart
Source: TradingView, prepared by Zain Vawda
IG CLIENT SETIMENT DATA
Taking a quick look at the IG Client Sentiment, Retail Traders are Long on GBPUSD with 52% of retail traders holding Long positions. This is another sign of the indecision market participants are experiencing when it comes to USD pairs.
For tips and tricks regarding the use of client sentiment data, download the free guide below.
| Change in | Longs | Shorts | OI |
| Daily | 3% | 4% | 3% |
| Weekly | -6% | 19% | 4% |
— Written by Zain Vawda for DailyFX.com
Contact and follow Zain on Twitter: @zvawda


