S&P 500 Analysis
- Recent years have produced meagre returns for the S&P 500 in February
- Typical election year starts out poorly before surging higher – 60 Day Cop
- Market breadth appears to be pulling back slightly – catalyst needed to breach 5k mark on the S&P 500?
- The analysis in this article makes use of chart patterns and key support and resistance levels. For more information visit our comprehensive education library
Recommended by Richard Snow
Get Your Free Equities Forecast
Recent Years Have Seen Meagre Returns for the S&P 500 in February
The quiet period after the festive Christmas period has, according to data going back to 2007, witnessed very modest returns for the S&P 500. In fact, over the same time horizon, it represents the third worst month for the index.
With earnings reports for most of the ‘magnificent seven’ behind us, equities may be entering a period where upside momentum begins to slow – particularly ahead of the psychological 5000 level.
S&P 500 Seasonality Chart Showing Average Monthly Returns from 2007 to Present
Source: Refinitiv, prepared by Richard Snow
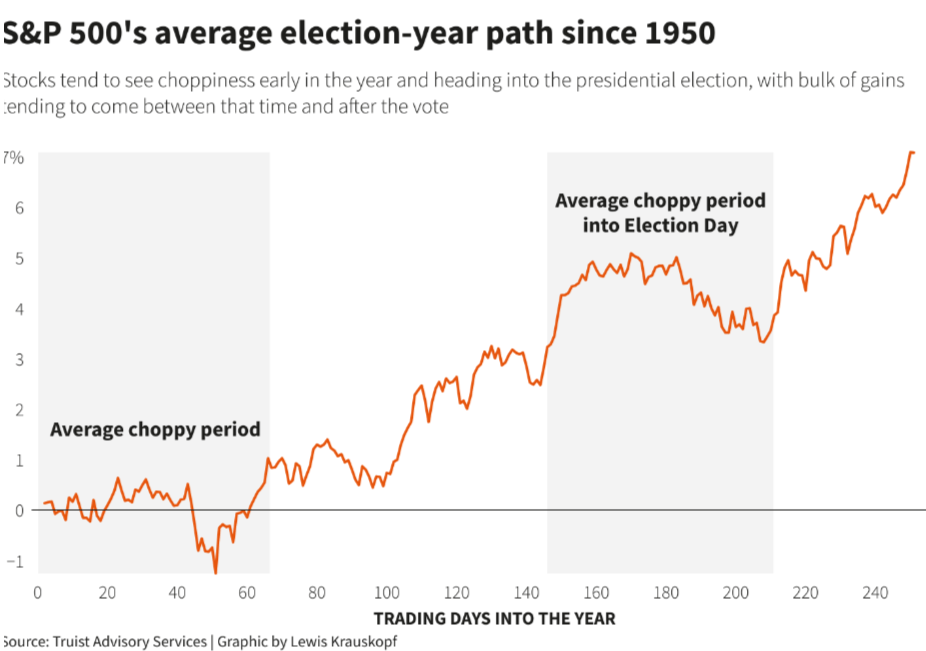
Typical Election Year Starts out Poorly Before Surging Higher – 60 Day Chop
In a typical election year, the first three months or 60 trading days have exhibited very choppy returns around the zero mark, according to data going back to 1950. However, after March fortunes have appeared much brighter, seeing significant improvement in the lead up and sometime after the actual vote to end up around 7% for the year.
Source: TradingView, prepared by Richard Snow
Market breadth appears to be pulling back – Catalyst needed to breach 5k mark?
The US stock market and the underlying US economy is advancing at an encouraging pace. Non-farm payroll data saw positive markups on the December and January figures, GDP is moderating but still beating estimates and the services sector expands for the 13th straight month with forward-looking indicators like ‘new orders’ moving higher.
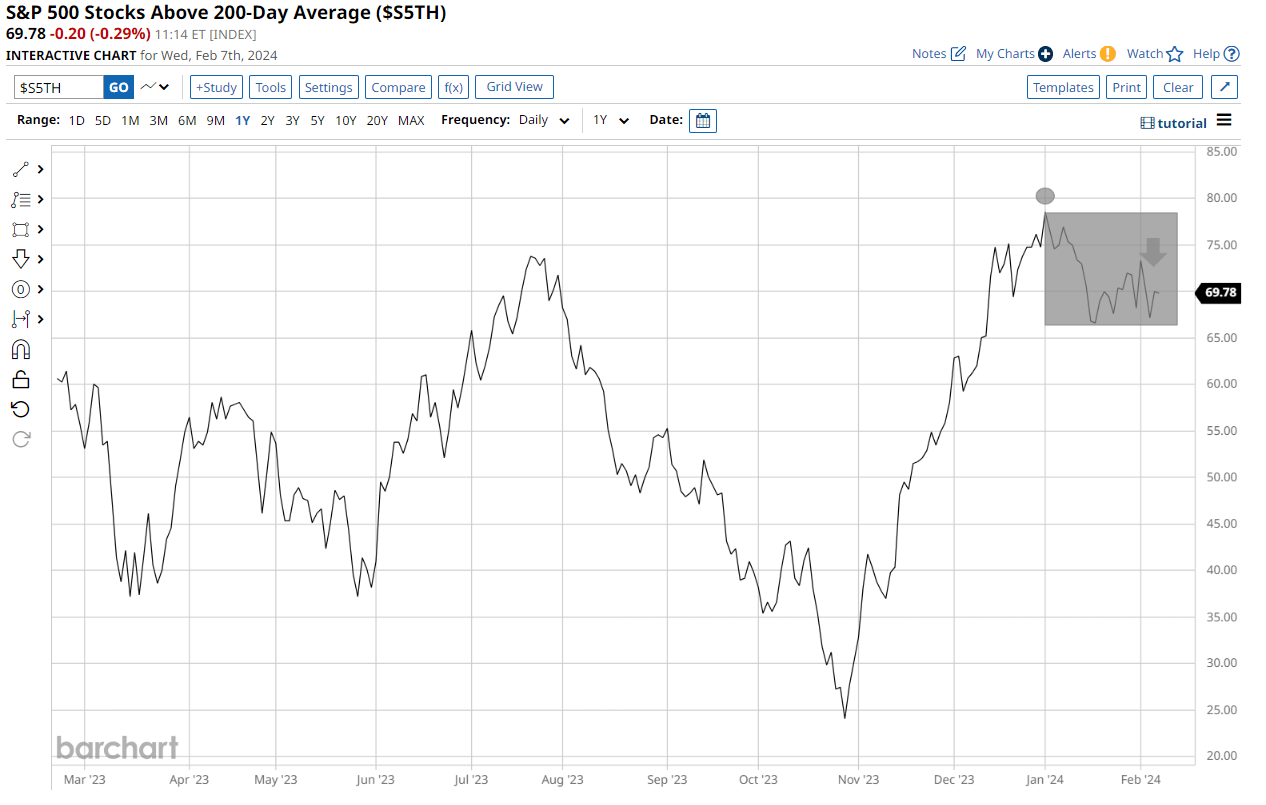
In addition, earnings season has welcomed solid earnings reports for the majority of mega-cap stocks, pulling the rest of the index higher in the process as January appears to show a come down in market breadth since the end of last year. Mega-cap stocks continue to hold influence over the index as a whole and are more than capable of dragging the remaining 493 stocks to new index highs, but that will require some heavy lifting from the US heavyweights.
Bullish momentum is easier to get behind when the majority of stocks are pulling in the same direction and may face difficulty if pockets/sectors begin to witness declines. Thus far it looks like stocks are consolidating or easing slightly after the broadly inclusive rally into year end.
Percentage of S&P 500 Stocks above their 200 SMAs (Measure of Market Breadth)
Source: barchart.com, prepared by Richard Snow
We studied thousands of accounts to discover what successful traders get right! Download the summary of our findings below:
Recommended by Richard Snow
Traits of Successful Traders
S&P 500 Approaches the Psychological 5,000 Mark
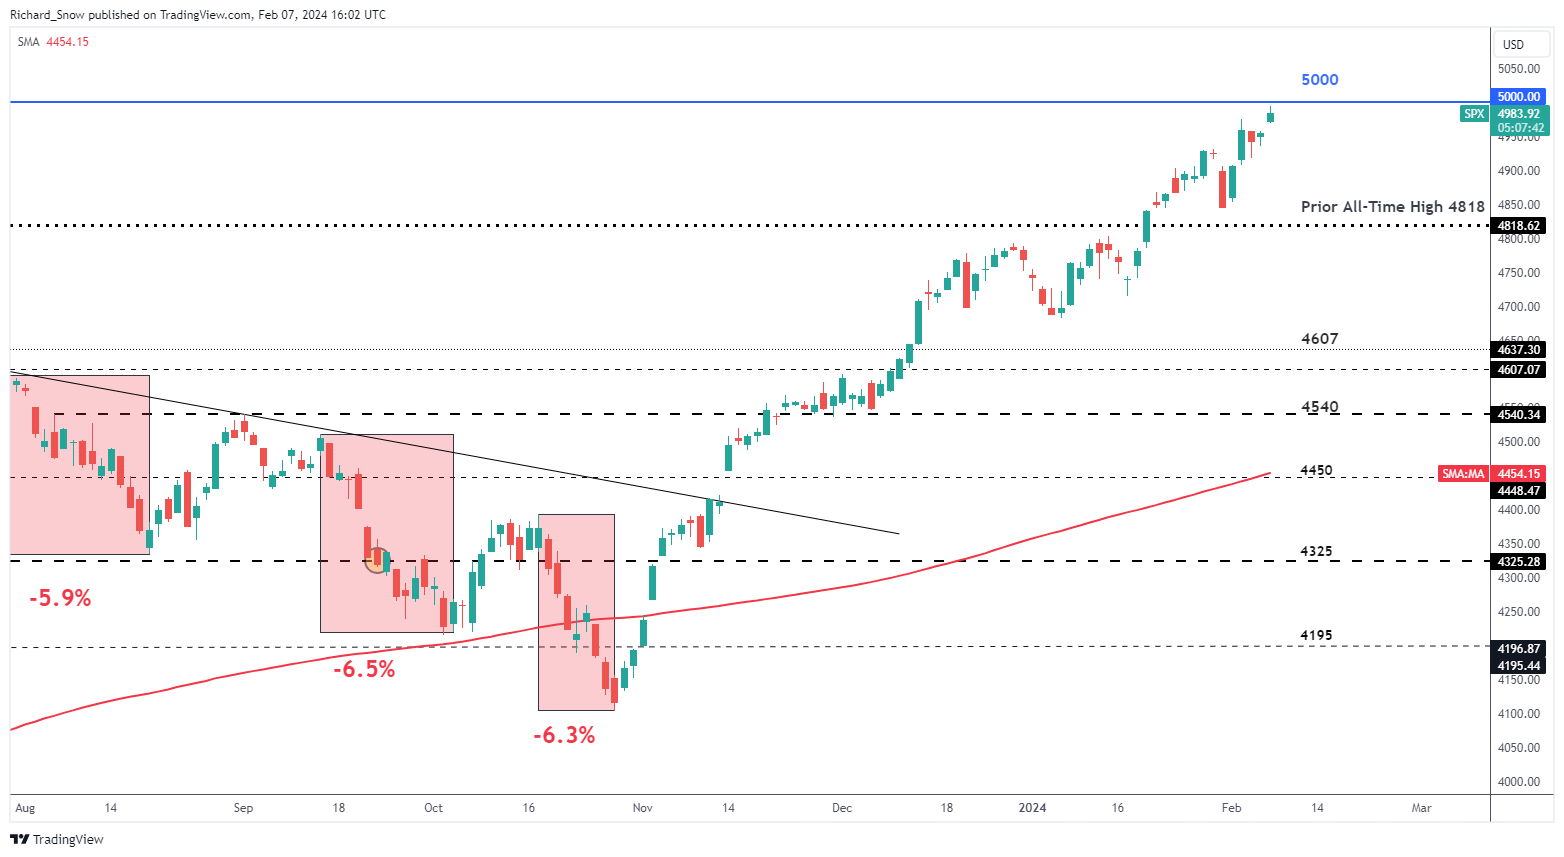
The S&P 500 is on the edge of hitting the 5,000 mark – a significant psychological level for the index outperforming many others at the moment. US stocks were said to come under pressure as interest rates rose above 5% but AI, cloud and tech stocks have shaken off those concerns with some reaching all-time highs.
While history suggests February may slow the bull run, price action remains key. There has been little sign of a reversal in the index and each pullback has proven to offer more attractive levels to buy the tip. The bullish bias remains constructive unless signs to the contrary emerge.
S&P 500 Daily Chart
Source: TradingView, prepared by Richard Snow
— Written by Richard Snow for DailyFX.com
Contact and follow Richard on Twitter: @RichardSnowFX


